Hello! Welcome back.
In our last lesson, we built confidence in our application's correctness by writing integration tests with testcontainers-go. We proved that our repository logic works with a real PostgreSQL database. Correctness is the foundation, but for systems like the message broker you're aiming to build, performance is a critical feature.
Today, we shift our focus from "Does it work?" to "How fast is it?"
Your Goal for Today
Learning Outcome: Benchmark critical code paths using Go's built-in benchmarking tools.
We'll explore Go's powerful, yet simple, benchmarking suite. This is the first step in performance engineering: you can't optimize what you can't measure.
We will cover:
- The anatomy of a Go benchmark and how to write one.
- How to run benchmarks and interpret the results for both speed (
ns/op) and memory (allocs/op). - Techniques for comparing different implementations side-by-side using sub-benchmarks.
- Common pitfalls, like compiler optimizations and including setup time, and how to avoid them for accurate measurements.
- How to use the
benchstattool for statistically sound comparisons.
1. The Anatomy of a Go Benchmark
Just like tests, benchmarks live in _test.go files and are part of the standard testing package. They have a specific signature that the Go toolchain recognizes.
Let's start with a quick visual introduction to the basic structure.
Zero Allocations And Benchmarking In Golang
This first video from Anthony GG's 'Zero Allocations And Benchmarking In Golang' series quickly covers the fundamental syntax of a benchmark function.
Watch from 00:36 to 01:29. Focus on these key points: The function must be in a _test.go file. The function name must be prefixed with Benchmark. The function accepts a pointer to testing.B, not testing.T.
As you just saw, the core of a benchmark is a loop that runs b.N times.
func BenchmarkMyFunction(b *testing.B) {
    // The benchmark framework automatically determines the value of b.N.
    // Our job is to loop exactly that many times.
    for i := 0; i < b.N; i++ {
        // The code we want to measure goes here.
        MyFunction()
    }
}
The testing package adjusts b.N automatically, running the loop until it has gathered a statistically stable measurement. This is a clever design that saves you from guessing how many iterations are needed.
For a detailed walkthrough of this basic structure, the following article provides a clear reference.
How to Benchmark Go Code with testing.B
The article 'How to Benchmark Go Code with testing.B' by OneUptime clearly lays out the fundamentals.
Read the sections 'Understanding Benchmark Basics' and 'Understanding b.N and Iteration Counting'. These sections reinforce the core concepts and highlight important rules for using b.N correctly.
2. Running Benchmarks and Interpreting the Output
Once you've written a benchmark function, you can run it using go test with the -bench flag. The flag accepts a regular expression to match benchmark names. To run all benchmarks in the current package, you use -bench=..
The real power comes from also measuring memory allocations. For systems programming, minimizing allocations is often the most effective way to improve performance, as it reduces pressure on the garbage collector (GC). You can do this with the -benchmem flag.
# Run all benchmarks in the current package and show memory stats
go test -bench=. -benchmem
The output will look something like this:BenchmarkMyFunction-16 1234567 150.2 ns/op 48 B/op 2 allocs/op
This video explains what each part of that output means.
Zero Allocations And Benchmarking In Golang
Let's return to Anthony GG's video to see a demonstration of running a benchmark and an explanation of the output.
Watch from 03:17 to 03:59. The key metrics to understand are: ns/op: Nanoseconds per operation (lower is better). B/op: Bytes allocated per operation (lower is better). allocs/op: The number of memory allocations per operation (lower is better, and zero is ideal for hot paths).
As an experienced programmer, you can see how these metrics provide a multi-dimensional view of performance. A function might be fast in terms of raw execution (ns/op), but if it creates a lot of garbage (B/op and allocs/op), it could degrade overall system performance at scale.
3. Avoiding Common Pitfalls
To get accurate measurements, you must be careful to benchmark only the code you intend to measure. Two common pitfalls can invalidate your results:
1. Including Setup Time: If your benchmark requires expensive setup (e.g., creating a large data slice), that setup time must be excluded from the measurement.
2. Compiler Optimization: The Go compiler is very aggressive. If it sees that the result of a function call inside your benchmark loop is never used, it may decide the function call is unnecessary and eliminate it entirely, leading to misleadingly fast results.
The solution to these problems is to use b.ResetTimer() after your setup and to assign the result of your benchmarked function to a package-level variable to ensure the compiler can't optimize it away.
How to Benchmark Go Code with testing.B
The OneUptime article provides excellent examples of these pitfalls and how to correctly handle them.
Please read the sections 'Benchmark Setup and Cleanup' and 'Avoiding Common Pitfalls'. Pay close attention to the code examples demonstrating the use of b.ResetTimer() and the package-level variable trick to prevent compiler optimization.
Here is the canonical structure for an accurate benchmark:
// Declare a package-level variable to store the result.
var result MyResultType

func BenchmarkMyFunction(b *testing.B) {
    // 1. Perform any expensive setup here.
    input := generateHeavyInput()

    // 2. Reset the timer to zero so setup time isn't counted.
    b.ResetTimer()

    var r MyResultType // Local variable to avoid data races in parallel benchmarks
    for i := 0; i < b.N; i++ {
        // 3. Run the code to be benchmarked.
        r = MyFunction(input)
    }

    // 4. Assign the final result to the package-level variable.
    // This ensures the compiler cannot optimize away the loop.
    result = r
}
4. Comparing Implementations with Sub-benchmarks
One of the most powerful uses of benchmarking is to make data-driven decisions when choosing between different algorithms or implementations. Go's b.Run method, which works just like t.Run for tests, makes this incredibly easy.
This pattern allows you to create table-driven benchmarks to compare performance across different inputs or to compare multiple function implementations against the same input.
This video demonstrates a very common Go optimization: pre-allocating a slice versus appending dynamically. It uses b.Run to clearly show the performance difference.
Zero Allocations And Benchmarking In Golang
Watch this segment to see a practical example of identifying and fixing a performance issue using benchmarks.
Watch from 03:59 to 07:50. This section is packed with value: First, it shows two separate benchmark functions and their results. Then, it refactors them into a single, clean benchmark using b.Run to compare the 'non-allocated' vs. 'allocated' strategies side-by-side. \nNotice the dramatic drop in allocs/op from 8 to 1. This is a classic and impactful optimization.
5. Hands-On Application: Serializing Data for the Wire
In the message broker you'll be building, serializing and deserializing messages is a critical path. The efficiency of your wire format directly impacts throughput and latency. Let's write a benchmark to compare two common serialization strategies: standard encoding/json versus a simple, manual binary encoding.
Create a new file internal/serialization/protocol_test.go.
internal/serialization/protocol.go (add this new file)
package serialization

import (
	"encoding/binary"
	"encoding/json"
)

type Message struct {
	ID      uint64
	Payload []byte
}

// MarshalJSON uses the standard library's JSON marshaler.
func (m *Message) MarshalJSON() ([]byte, error) {
	return json.Marshal(m)
}

// MarshalBinary encodes the message into a simple binary format:
// 8 bytes for ID (uint64, big-endian)
// N bytes for Payload
func (m *Message) MarshalBinary() []byte {
	// Size is 8 bytes for ID + length of payload
	buf := make([]byte, 8+len(m.Payload))
	binary.BigEndian.PutUint64(buf[0:8], m.ID)
	copy(buf[8:], m.Payload)
	return buf
}
internal/serialization/protocol_test.go
package serialization

import "testing"

var resultBytes []byte

func BenchmarkSerialization(b *testing.B) {
	msg := &Message{
		ID:      123456789,
		Payload: []byte("this is a test payload for our message broker"),
	}

	b.Run("JSON", func(b *testing.B) {
		b.ReportAllocs() // Explicitly report allocations for this sub-benchmark
		var r []byte
		var err error

		b.ResetTimer()
		for i := 0; i < b.N; i++ {
			r, err = msg.MarshalJSON()
			if err != nil {
				b.Fatal(err)
			}
		}
		resultBytes = r
	})

	b.Run("Binary", func(b *testing.B) {
		b.ReportAllocs()
		var r []byte

		b.ResetTimer()
		for i := 0; i < b.N; i++ {
			r = msg.MarshalBinary()
		}
		resultBytes = r
	})
}
Now, run the benchmark from your project's root directory:go test -bench=BenchmarkSerialization -benchmem ./internal/serialization
You should see a dramatic difference. The Binary version will likely be an order of magnitude faster and, most importantly, should have zero allocations within the benchmarked function itself (the initial make is part of the implementation, not an overhead of the process). This is because we calculate the exact size needed and allocate only once. The JSON marshaler, being more generic, requires more work and allocations under the hood. This is a perfect example of a data-driven optimization you might make for your broker's hot path.
6. Advanced: Statistical Comparison with benchstat
When a performance change is small, it can be hard to tell if it's a real improvement or just random noise. The benchstat tool provides a statistical analysis to give you confidence in your results.
The workflow is:
- Run the benchmark multiple times on your baseline code (
mainbranch) and save the output. - Make your change.
- Run the benchmark multiple times again and save the new output.
- Compare the two files with
benchstat.
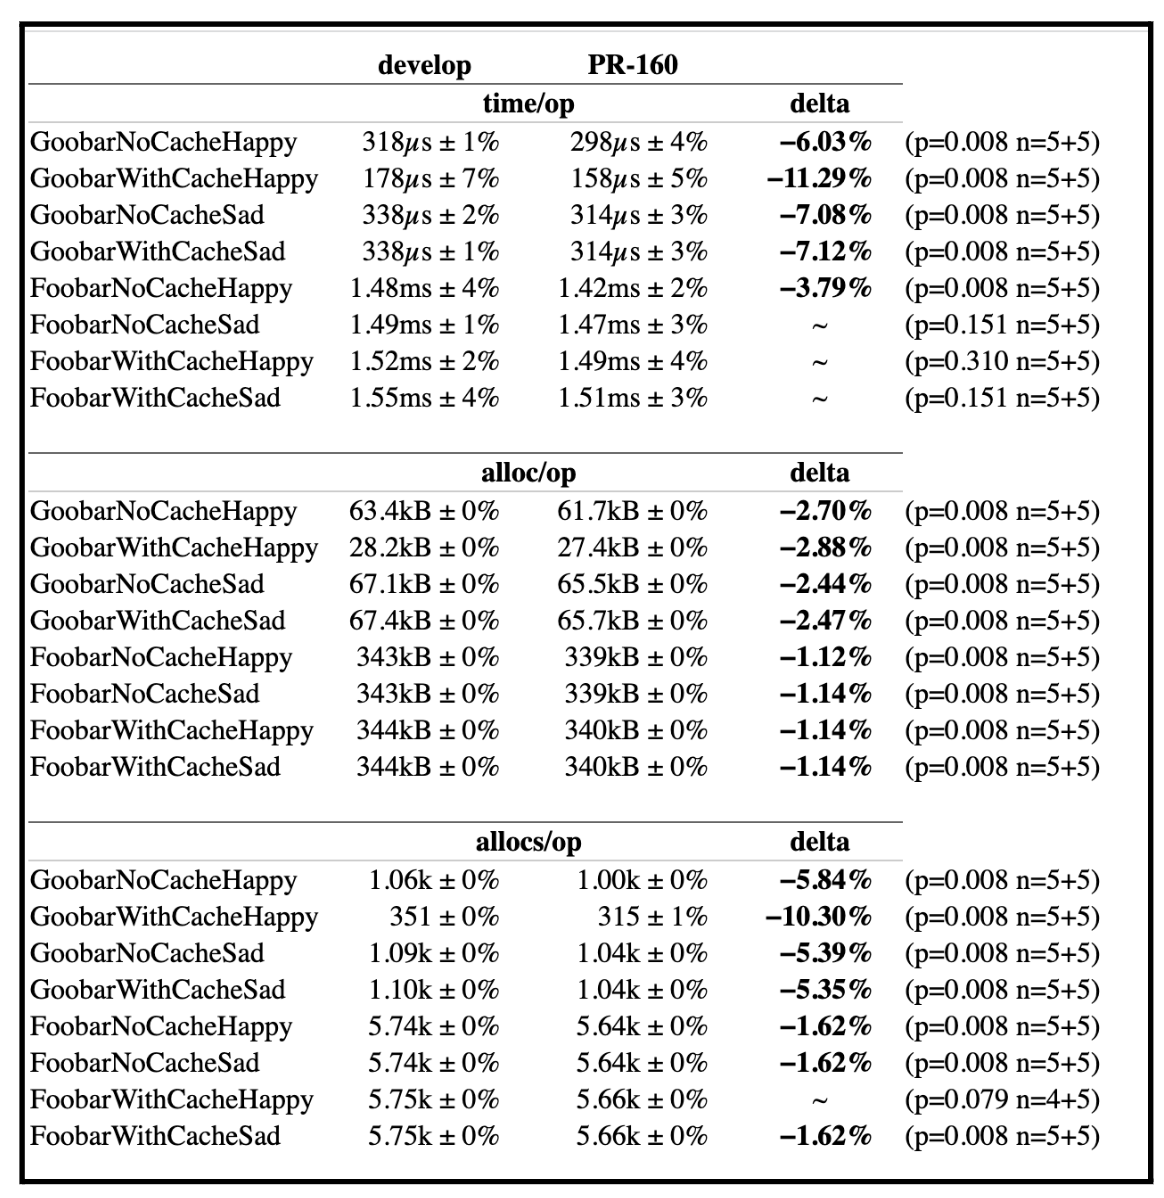
How to Benchmark Go Code with testing.B
For a complete guide on this workflow, let's turn back to the OneUptime article.
Read the section 'Comparing Benchmark Results with benchstat'. It covers installation and the full command sequence for collecting and comparing data.
You won't need benchstat every day, but for rigorously validating critical optimizations, it is an indispensable tool.
Conclusion
You now have a solid foundation for measuring and analyzing the performance of your Go code. This skill is fundamental to writing high-performance systems and moving from a developer who writes correct code to one who writes efficient and scalable code.
Key Takeaways:
- Benchmarks are Go functions named
BenchmarkXxx(*testing.B)that live in_test.gofiles. - The core metrics are
ns/op(time),B/op(bytes allocated), andallocs/op(number of allocations). Reducing allocations is a key optimization strategy. - Use
b.Runto create table-driven benchmarks for comparing implementations or testing different inputs. - Always use
b.ResetTimer()after setup and assign results to a package-level variable to ensure your measurements are accurate. - For rigorous analysis, use
benchstatto determine if performance changes are statistically significant.
Next Up
Benchmarking is excellent at telling you how fast a function is (the "what"). But when a benchmark is slow, it doesn't always tell you why. In the next lesson, we will dive into profiling. You'll learn to use pprof to capture detailed CPU and memory profiles, allowing you to pinpoint the exact lines of code that are consuming the most resources and become a true performance detective.