Hello! Welcome to the final lesson in our module on the behavior of gases.
In our last lesson, we explored the van der Waals equation as a model for real gases, focusing on how its correction terms for molecular volume (b) and intermolecular forces (a) allow us to solve for properties like pressure more accurately than the ideal gas law.
Today, we will build directly on that foundation to explore the compressibility factor (Z). This is a crucial tool for quantitatively comparing how much a real gas's behavior deviates from the predictions of the ideal gas law. Mastering this concept is essential for tackling many conceptual and numerical problems on real gases in the JEE Advanced exam.
By the end of this lesson, you will be able to interpret Z vs. Pressure graphs, understand how temperature affects gas ideality, and mathematically connect the compressibility factor to the van der Waals equation under various conditions.
1. Defining and Visualizing the Compressibility Factor (Z)
The simplest way to quantify the deviation of a real gas from ideal behavior is to compare the value of to , where is the molar volume (). For an ideal gas, this ratio is always 1. For a real gas, it deviates. We define this ratio as the compressibility factor, .
Since for an ideal gas at the same pressure and temperature, , we can also express as a ratio of volumes:
This gives a clear physical meaning to :
- If : The gas behaves ideally. .
- If : The gas shows a negative deviation. The actual volume is less than the ideal volume. This indicates that intermolecular attractive forces are dominant, pulling the molecules closer together and making the gas more compressible than an ideal gas.
- If : The gas shows a positive deviation. The actual volume is greater than the ideal volume. This indicates that molecular volume and repulsive forces are dominant, pushing the molecules apart and making the gas less compressible than an ideal gas.
To see how this plays out for different gases, let's watch a short video segment.
10.4 Real Gases & the Van der Waals Equation | General Chemistry
This clip from 'Real Gases & the Van der Waals Equation' by Chad's Prep provides an excellent graphical introduction to the compressibility factor, showing how different real gases deviate from the ideal gas line (Z=1).
Watch from 00:43 to 03:11. Focus on the Z vs. P graph and the explanation for why the curves for N₂, CH₄, and H₂ behave the way they do.
The video introduces a typical Z vs. P plot. Let's look at another example.
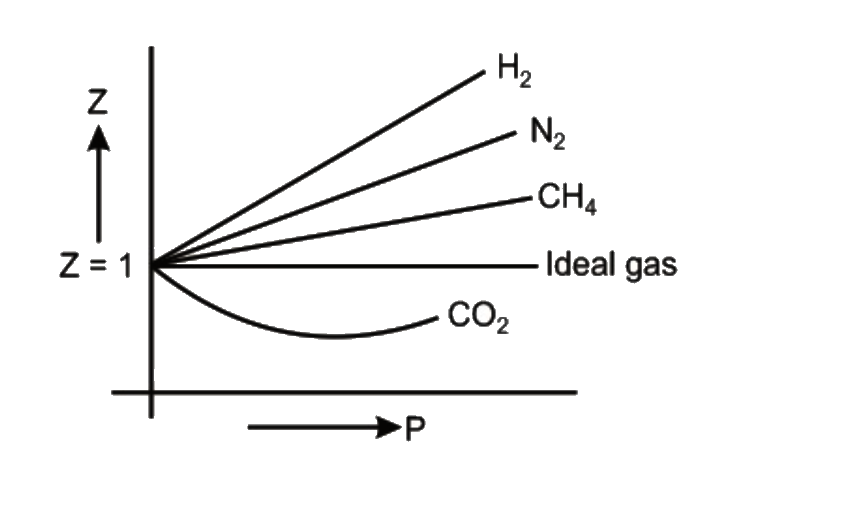
From this graph, you can draw several conclusions:
- All gases approach ideal behavior () as pressure approaches zero.
- Gases with stronger intermolecular forces (like CO₂, which has a larger 'a' value) show a more significant dip (negative deviation) at low pressures.
- Gases with very weak intermolecular forces (like H₂) show almost no negative deviation; for them, the repulsive forces due to molecular size dominate at nearly all pressures, so .
2. Analyzing the Effects of Pressure and Temperature
The behavior of Z is not static; it depends strongly on both pressure and temperature.
Effect of Pressure
As we saw in the graph above, for a typical gas like N₂ or CH₄:
- Low Pressure Region: The curve dips below . Here, the volume is large, so molecules are relatively far apart but still feel each other's attractive forces. This attraction reduces the pressure compared to an ideal gas, causing to be less than 1.
- High Pressure Region: The curve rises above . Here, the volume is small, and molecules are forced very close together. The finite volume of the molecules themselves and the resulting repulsive forces become the dominant factor, causing the gas to be less compressible than an ideal gas.
Effect of Temperature
What happens if we run the experiment at different temperatures?
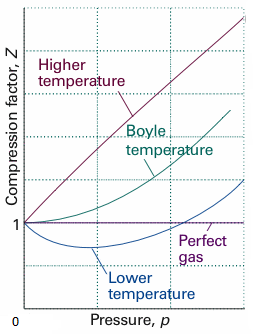
Notice that as the temperature increases:
- The dip in the curve becomes less pronounced.
- The pressure range over which the gas behaves ideally () expands.
This is because at higher temperatures, the kinetic energy of the molecules () becomes much larger than the potential energy of intermolecular attraction (which is related to the van der Waals constant 'a'). The molecules are moving too fast to be significantly affected by attractive forces.
This leads to a special temperature known as the Boyle Temperature (). This is the temperature at which a real gas behaves almost ideally over a wide range of low to moderate pressures. On the graph, this is the temperature where the curve becomes nearly flat and horizontal near , and the initial dip disappears completely.
3. Mathematical Analysis using the Van der Waals Equation
Your strong mathematical background is a great asset here. We can derive these observed behaviors by analyzing the van der Waals equation under different limiting conditions. This is a classic approach for JEE Advanced problems.
Modifications of Van Der Waals Equation & Compressibility Factor
The following text from an Aakash Institute study guide provides a concise but powerful mathematical breakdown of how the compressibility factor Z behaves under different pressure regimes based on the van der Waals equation.
Read the sections titled 'In moderately low pressure regions' and 'In high-pressure regions'. Pay close attention to the approximations made and the resulting simplified expressions for Z. Also, read the section 'Exceptional behaviour of hydrogen and helium'.
Let's summarize and formalize the key derivations from that reading.
We start with the van der Waals equation for one mole:
Case 1: Moderately Low Pressure
- Approximation: Volume is large, so we can neglect the small term in comparison to . Thus, .
- Derivation:
Dividing by RT:
This equation mathematically confirms that at low pressures, is less than 1, explaining the initial dip in the curve due to the attractive forces (term 'a').
Case 2: High Pressure
- Approximation: Pressure is very large. The internal pressure correction becomes negligible in comparison to . Thus, . However, at high pressure, is small and is now comparable to , so we cannot neglect .
- Derivation:
Dividing by RT:
This result shows that at high pressures, and increases linearly with pressure. This explains the positive deviation and the upward slope of the curve.
Test your understanding!
Using the results from the mathematical analysis, explain why the Z vs. P curve for Hydrogen (H₂) is almost a straight line with a positive slope, starting from Z=1.
Show answer
Hydrogen is a very small molecule with extremely weak intermolecular attractions. This means its van der Waals constant 'a' is very close to zero.
Because 'a' is negligible, the "low pressure" condition where attractive forces cause a dip () effectively doesn't exist for hydrogen at normal temperatures. The behavior is dominated by the molecular volume 'b' at almost all pressures.
Therefore, the "high pressure" approximation, , becomes valid across a much wider range of pressures. This equation is of the form , where , , the intercept , and the slope . This explains why the plot for H₂ is a nearly straight line with a positive slope starting at .
Boyle's Temperature ()
We can also derive an expression for the Boyle Temperature. For a gas to behave ideally, the effects of attraction ('a') and repulsion ('b') must cancel out. A more advanced expansion of the van der Waals equation (the virial equation) shows that the initial slope of the Z vs. P curve is proportional to .
At the Boyle Temperature, this initial slope is zero:
This provides a direct link between the macroscopic property of Boyle's temperature and the microscopic molecular properties represented by the constants 'a' and 'b'.
4. Application to Problem-Solving
Let's tackle a JEE Advanced-style numerical problem that directly uses the definition of the compressibility factor.
JEE Advanced Gaseous State Question
This problem from a collection of past JEE Advanced questions is a perfect application of the relationship between real and ideal molar volumes using Z.
Please read and solve the question that begins: 'A gas has a compressibility factor of 0.5 and a molar volume of 0.4 dm³ mol⁻¹ at a temperature of 800 K and pressure x atm...'
Let's walk through the solution:
Given:
- dm³ mol⁻¹ (which is the same as L/mol)
- K
- Pressure = atm
- Ideal molar volume = dm³ mol⁻¹
- L atm K⁻¹ mol⁻¹
Step 1: Find the ideal molar volume, y.
We use the definition .
Step 2: Find the pressure, x.
The ideal molar volume is related to pressure and temperature by the ideal gas law: .
In our notation, .
Step 3: Calculate the required ratio, x/y.
The final answer is 100. This problem demonstrates how Z acts as a direct bridge between the properties of a real gas and its hypothetical ideal counterpart.
Conclusion
This lesson concludes our module on the properties of gases, from the simple ideal gas model to the more nuanced behavior of real gases.
Key Takeaways:
- The compressibility factor is the definitive measure of a real gas's deviation from ideality.
- The value of Z tells us whether attractive forces () or repulsive forces/molecular volume () are dominant under given conditions.
- Z vs. P plots are a powerful tool for visualizing gas behavior, and their shape is determined by the gas itself (
a,bconstants), the pressure, and the temperature. - At the Boyle Temperature (), a real gas behaves ideally over a significant range of pressures as attractive and repulsive effects cancel each other out.
- By analyzing the van der Waals equation in limiting cases, we can derive expressions for Z that explain these experimental observations.
Preview of the Next Lesson:
We are now ready to venture into the core of this course: Thermodynamics. Our next module begins with the First Law of Thermodynamics. We will define the concepts of internal energy, heat, and work, and establish the crucial energy conservation principle that governs them. As you requested, we will place a strong emphasis on understanding and navigating the different sign conventions for work and heat from the very beginning.