Welcome back. In our previous lesson, we designed the 10-day content release sequence for the plunge bra campaign, engineering a narrative arc to maximize audience anticipation and engagement. We established a set of metrics to evaluate the sequence's effectiveness, like engagement velocity and save rates.
Now, we zoom out. An engaging sequence is a means to an end. The ultimate goal is commercial and brand success. This lesson addresses the core of your optimization goal: we will define the quantitative success metrics for the entire campaign, from brand perception to financial return, to create a comprehensive framework for evaluating its success.
As an efficiency expert with a background in Operations Research, you know that you cannot optimize what you cannot measure. This lesson is about building the "dashboard" for this campaign. We will define the Key Performance Indicators (KPIs) that tell us not only if the campaign worked, but how well it worked, and whether our efforts to engineer the "persona subversion" narrative delivered a measurable payoff.
1. A Multi-Layered Measurement Framework: The Marketing Funnel
A single metric, like sales, tells an incomplete story. A successful campaign must perform well at multiple stages of the customer journey. We can structure our measurement using the classic marketing funnel, which maps the path from initial awareness to final purchase.
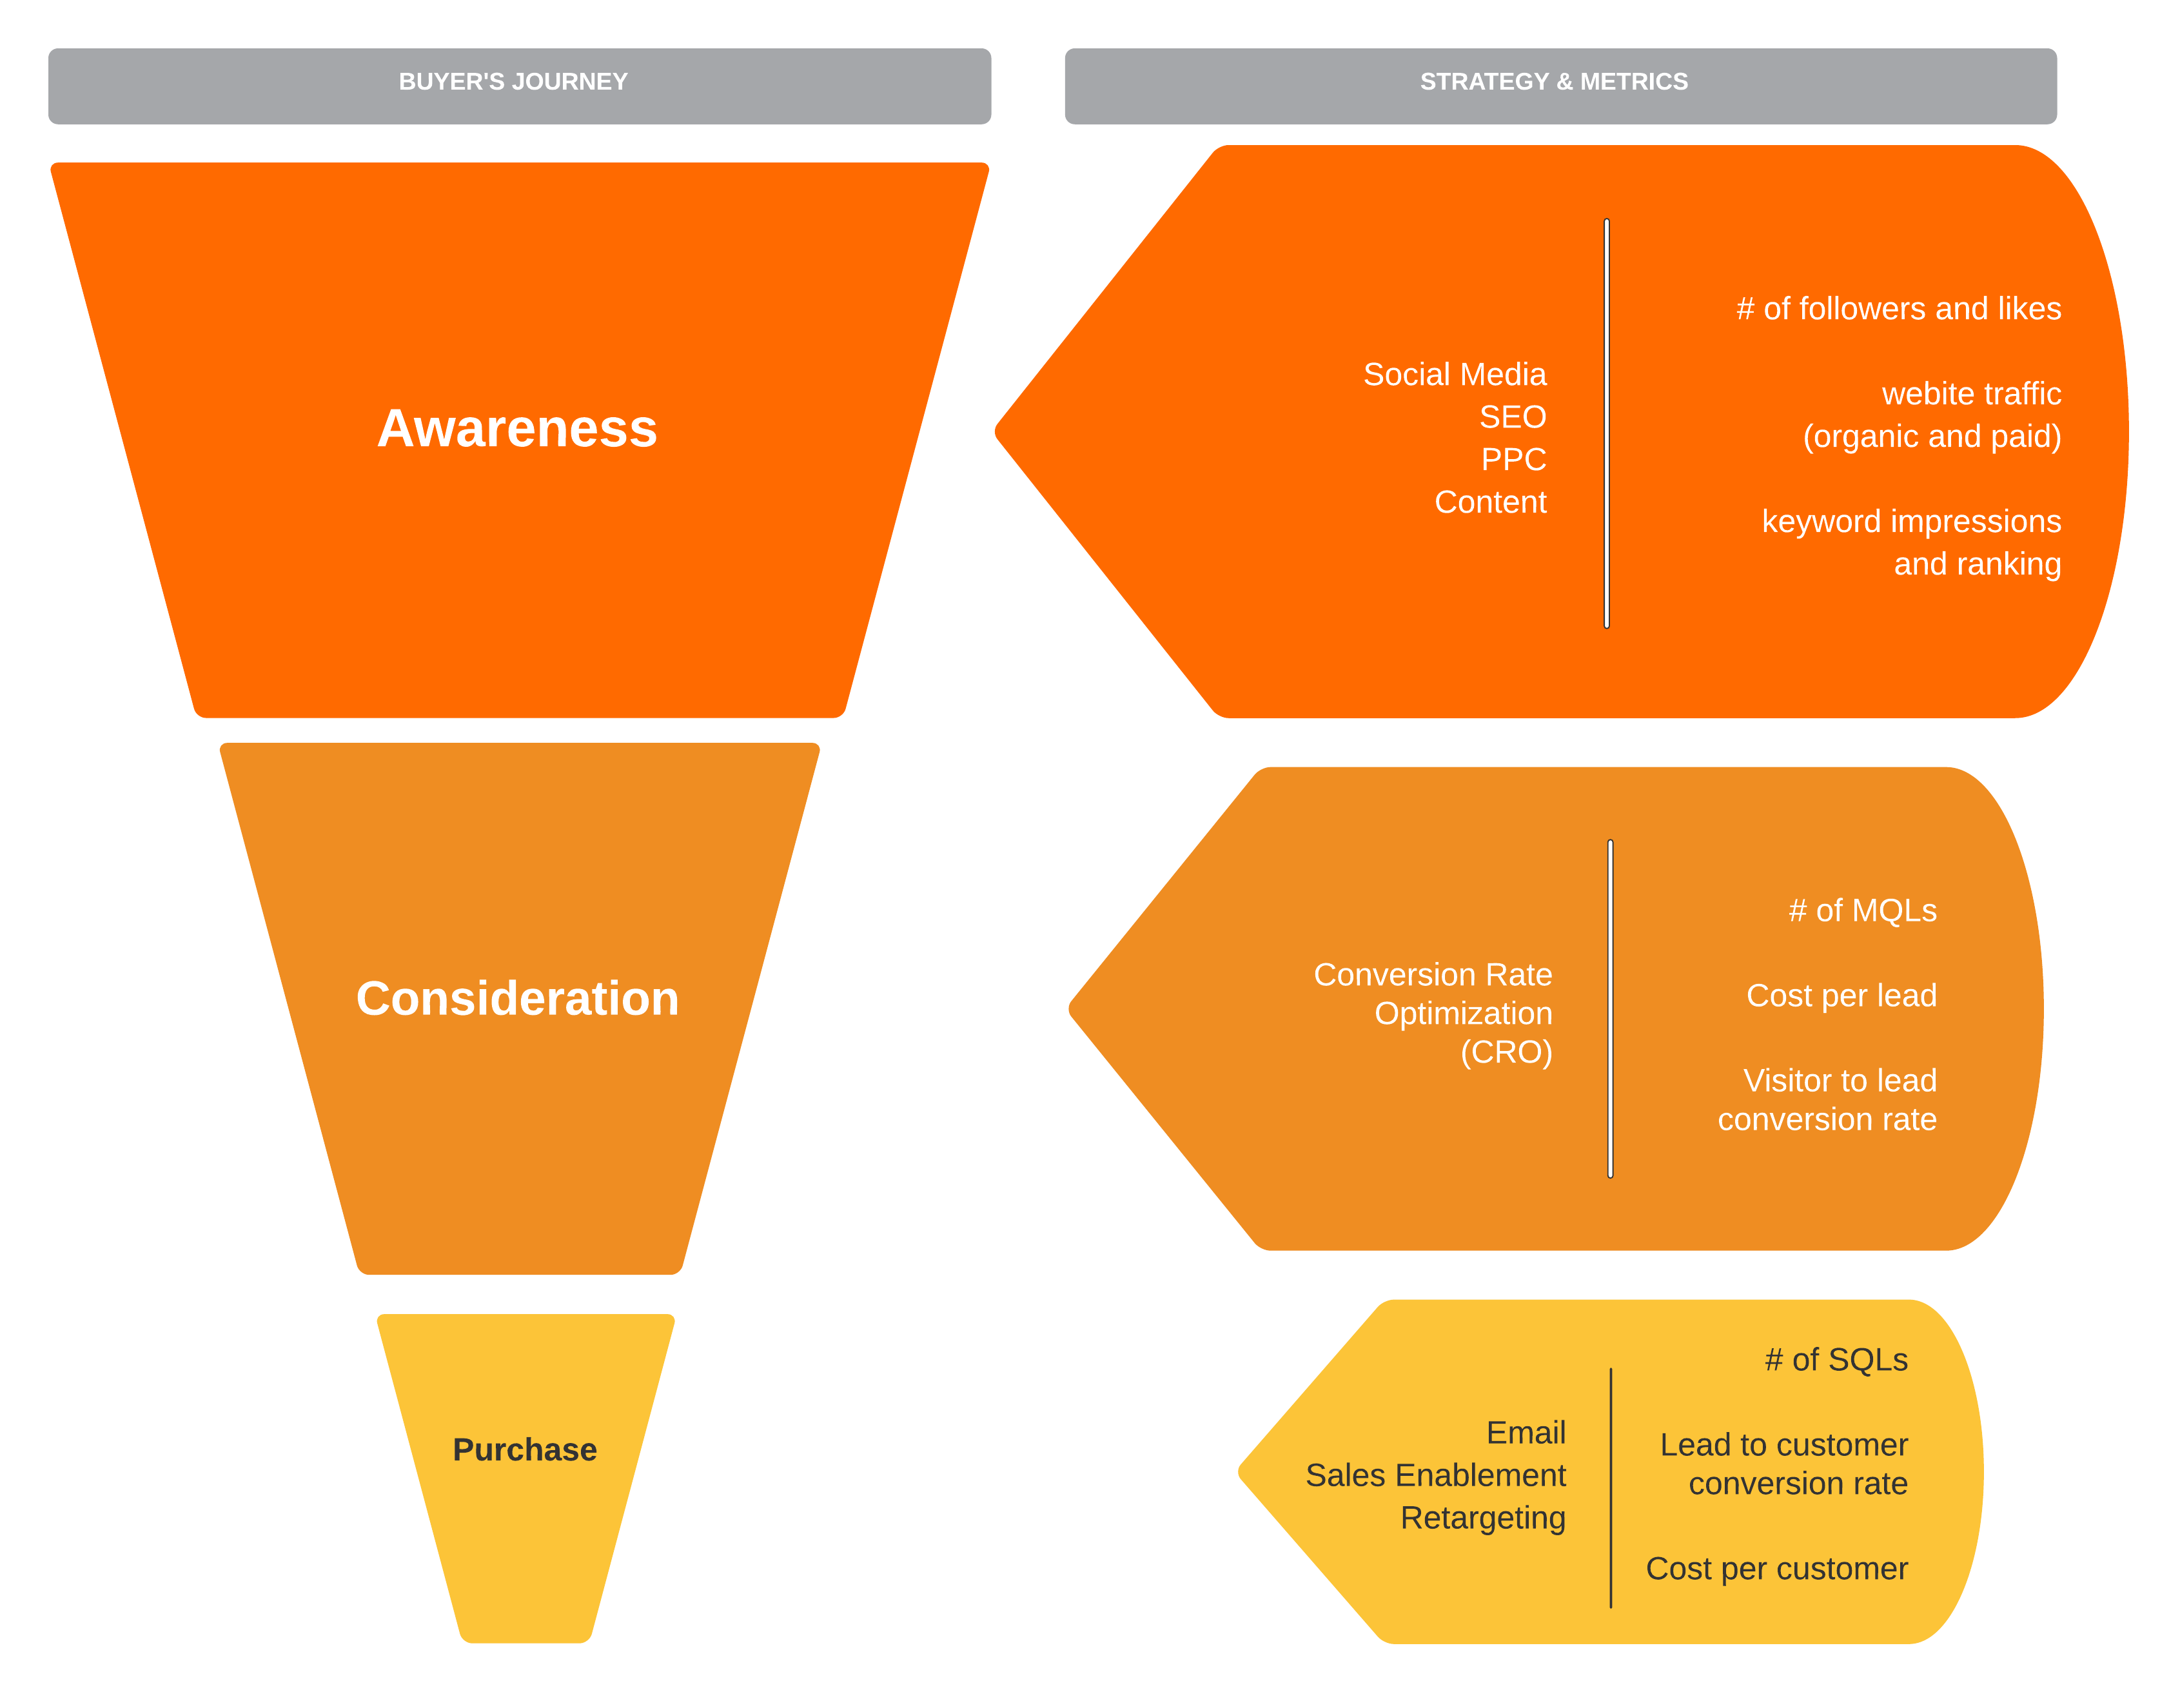
We will define metrics for each of these three core stages, plus a crucial fourth category that speaks directly to your expertise in systems thinking: guardrail metrics. This creates a "balanced scorecard" that prevents us from over-optimizing one area at the expense of another.
2. Tier 1: Awareness Metrics (Top of Funnel)
The first question is: did anyone notice? The top of the funnel is about capturing attention and making the brand and product visible. Our "persona subversion" narrative is designed to be memorable; these metrics tell us if it broke through the noise.
How to Measure Brand Awareness
This article from Helms Workshop provides an excellent breakdown of brand awareness, distinguishing between different types and detailing how to measure them using both survey methods and digital proxies.
First, read the introduction and the section Defining Brand Awareness to understand the key concepts of Unaided Awareness, Aided Awareness, and Top-of-Mind Awareness. Then, jump to the section Digital Metrics as Awareness Indicators, which details the practical, trackable proxies we can use for our campaign.
Based on this, here are the primary awareness metrics for our dashboard:
- Impressions: The total number of times the campaign content (across all 10 days) was displayed on screen. This is our broadest measure of visibility. A high number of impressions is the first necessary condition for success.
- Reach: The number of unique people who saw the campaign content. This tells us the actual size of the audience we reached.
- Brand Search Volume Lift: This is a powerful behavioral indicator. We would measure the percentage increase in people searching for the brand name (e.g., "[Brand Name]," "[Brand Name] plunge bra") on Google during the 10-day campaign period compared to the baseline period before it. A significant lift indicates the campaign successfully generated curiosity.
- Social Share of Voice: This measures the volume of conversation about our brand compared to key competitors during the campaign window. An increase in our share of voice means our narrative is capturing more of the public conversation.
For the plunge bra campaign, success at this stage means the teaser and build-up content were seen by a large, relevant audience, prompting them to actively seek more information about the brand.
3. Tier 2: Engagement & Consideration Metrics (Middle of Funnel)
Once people are aware, the next question is: do they care? This stage measures how effectively the narrative resonated with the audience, turning passive viewers into active participants. We touched on these in the last lesson; now we formalize them.
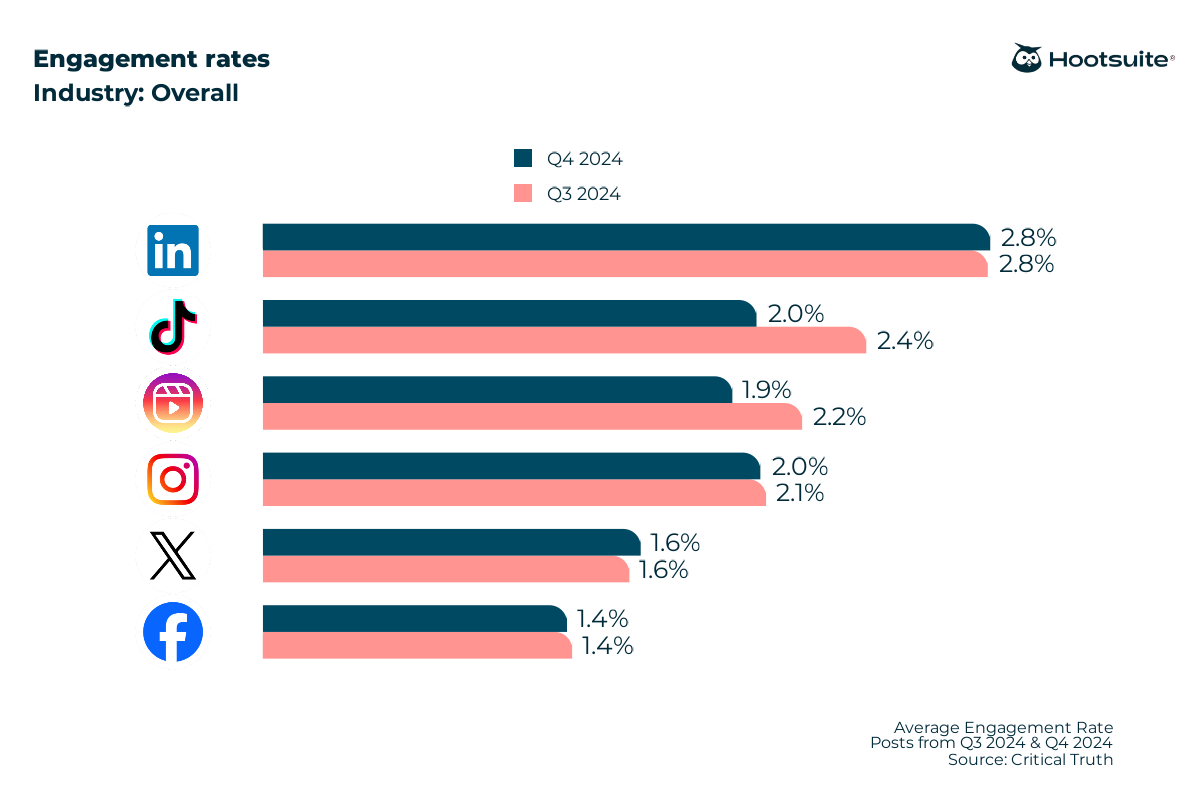
Essential Fashion Marketing KPIs & Metrics for 2025
This PostAffiliatePro article provides fashion industry-specific benchmarks for key metrics, which is invaluable for setting realistic targets.
Focus on the sections covering Conversion Rate and Click-Through Rate. Also, review the table under Marketing Channel Performance Metrics and the section on Social Media Engagement Rate for typical industry values.
Our key consideration metrics are:
- Engagement Rate: Calculated as (Total Interactions [Likes + Comments + Shares + Saves] / Total Reach) * 100. We will track this for each post in the sequence. A high engagement rate on the "Connection" and "Hype" content indicates the storytelling is effective. A benchmark of 1-5% on Instagram is typical for fashion.
- Click-Through Rate (CTR): This is the crucial link between engagement and conversion. We will measure the CTR on the "Link in Bio" from our Day 10 hero image reveal. It is calculated as (Total Clicks on Link / Total Impressions of Post) * 100. A high CTR here (e.g., >2%) shows strong purchase intent.
- Website Traffic (Referral): We will use analytics tools with UTM tags (unique tracking codes in our links) to measure how many visitors landed on the plunge bra's product page directly from our campaign posts.
Success at this stage means the "modest to bold" transformation narrative was compelling enough to make people click, comment, and, most importantly, visit the product page.
4. Tier 3: Conversion & Business Impact Metrics (Bottom of Funnel)
This is where the optimization pays off financially. Did the attention and engagement translate into sales?
Key Digital Marketing Metrics to Improve Your Results
This video from SiteGround offers clear, concise definitions of fundamental business metrics.
Watch the segments explaining Conversion rate and Return on Investment. These are the two most critical metrics for evaluating the financial success of the campaign.
Using the fashion industry benchmarks from the PostAffiliatePro article, we will focus on these bottom-of-funnel KPIs:
- Conversion Rate: The percentage of website visitors from the campaign who purchase the plunge bra. A typical fashion e-commerce conversion rate is 2.9-3.3%. Our goal should be to meet or exceed this, proving our highly targeted narrative attracts qualified buyers.
- Average Order Value (AOV): The average total value of each order that includes the campaign's plunge bra. A higher AOV suggests customers were inspired to buy complementary items (like the thong), increasing overall profitability.
- Return on Investment (ROI): The ultimate measure of efficiency. Calculated as: The "Cost of Campaign" includes photoshoot expenses (model, photographer, location), ad spend, and any other associated costs. A positive ROI means the campaign was profitable.
5. Tier 4: Guardrail & Long-Term Metrics
Your OR background emphasizes understanding the entire system, including unintended consequences. Guardrail metrics are designed to detect negative side-effects, ensuring we don't achieve a local optimum (e.g., high engagement) while damaging the larger system (the brand).
How to Answer: Metrics to Measure Success (Product Manager Interview Question)
This video on product management metrics provides an excellent framework for thinking about success holistically, including the crucial concept of guardrail metrics.
Watch the discussion on the three categories of sub-metrics, paying close attention to the final part explaining guardrail metrics. The video explains them as safeguards against over-optimizing for a single goal.
Here are the guardrails for our campaign:
- Negative Sentiment & Unfollow Rate: Our "provocative" narrative carries risk. We must monitor comments for negative sentiment (e.g., accusations of cultural disrespect, objectification). A spike in the Instagram account's unfollow rate during the campaign is a critical red flag.
- Product Page Bounce Rate: This is the percentage of visitors from the campaign who land on the product page and leave without taking any action. A high bounce rate (>50%) is a guardrail metric indicating a severe mismatch between the campaign's promise and the product page's reality. It tells us our traffic is unqualified.
- Return Rate: The percentage of plunge bras sold during the campaign that are returned. The PostAffiliatePro article notes a 20-30% return rate is common in fashion. A rate significantly higher than this could indicate the campaign created inaccurate expectations about the product's fit or quality.
Finally, we consider long-term value:
- Customer Lifetime Value (CLV): We should track the long-term spending of customers acquired through this campaign. Do they make repeat purchases? A high CLV would prove the campaign attracted valuable, loyal customers, not just one-time buyers.
Your Campaign Success Dashboard
To make this operational, we can consolidate these metrics into a single dashboard. This is the quantitative summary of our optimization effort.
| Category | Metric | Goal / Benchmark | Why It Matters |
|---|---|---|---|
| Awareness | Impressions | > 1,000,000 | Measures total campaign visibility. |
| Brand Search Lift | > 20% | Shows the campaign generated active interest. | |
| Engagement | Avg. Engagement Rate | > 2% (Instagram) | Proves the narrative resonated with the audience. |
| Reveal Post CTR | > 2.5% | Measures direct intent to purchase. | |
| Conversion | Conversion Rate | > 3% | The ultimate measure of persuasive effectiveness. |
| ROI | > 100% | Confirms financial profitability of the campaign. | |
| Guardrails | Unfollow Rate Spike | < 5% vs. baseline | Catches audience backlash early. |
| Product Page Bounce | < 40% | Ensures traffic quality and landing page alignment. |
Conclusion
You have now established a comprehensive, multi-layered framework to quantitatively evaluate the success of the plunge bra campaign. This goes far beyond simple engagement metrics to create a holistic view of performance, from top-of-funnel awareness to bottom-line profitability and long-term brand health.
Key Takeaways:
- Campaign success must be measured across the entire marketing funnel: Awareness, Engagement, and Conversion.
- Digital proxies (like Brand Search Lift) and fashion-specific benchmarks (like a 3% conversion rate) make measurement practical and realistic.
- Financial metrics like ROI are the ultimate test of an optimization strategy's business value.
- Guardrail metrics (like Unfollow Rate and Bounce Rate) are essential for any systems thinker, preventing local optimization from causing broader harm.
With this measurement dashboard, you are not just executing a creative idea; you are running a controlled experiment. You have defined the terms of success. In our next lesson, we will begin the "Risk Analysis & Mitigation" module by identifying the top emotional and controversy risks for our two scenarios and designing contingency plans—a process that will be directly informed by the guardrail metrics you've just defined.