Welcome to our third lesson. In our previous session, we focused on the anatomy of data, learning to classify variables by their intrinsic type: categorical (nominal, ordinal) or numerical (discrete, continuous). This is the first step in any analysis. Today, we'll add a second, equally important layer of classification based on the role a variable plays within a research question.
This lesson addresses a cornerstone concept in medical research: distinguishing between independent and dependent variables. Mastering this will enable you to deconstruct any research hypothesis, a critical skill for designing studies, choosing the correct statistical tests, and interpreting results. This moves us closer to your goal of confidently handling statistical work for medical research papers.
The Logic of Cause and Effect
At its heart, most quantitative research tries to understand if and how one thing affects another. This relationship is framed using two key roles for our variables:
- Independent Variable (IV): The presumed cause. This is the variable that you, the researcher, either manipulate (in an experiment) or observe to see its effect on something else. It is also known as the predictor, explanatory, or exposure variable.
- Dependent Variable (DV): The presumed effect or outcome. This is the variable that is measured to see how it changes in response to the independent variable. It is also known as the response or outcome variable.
A simple way to remember this is that the dependent variable depends on the independent variable.
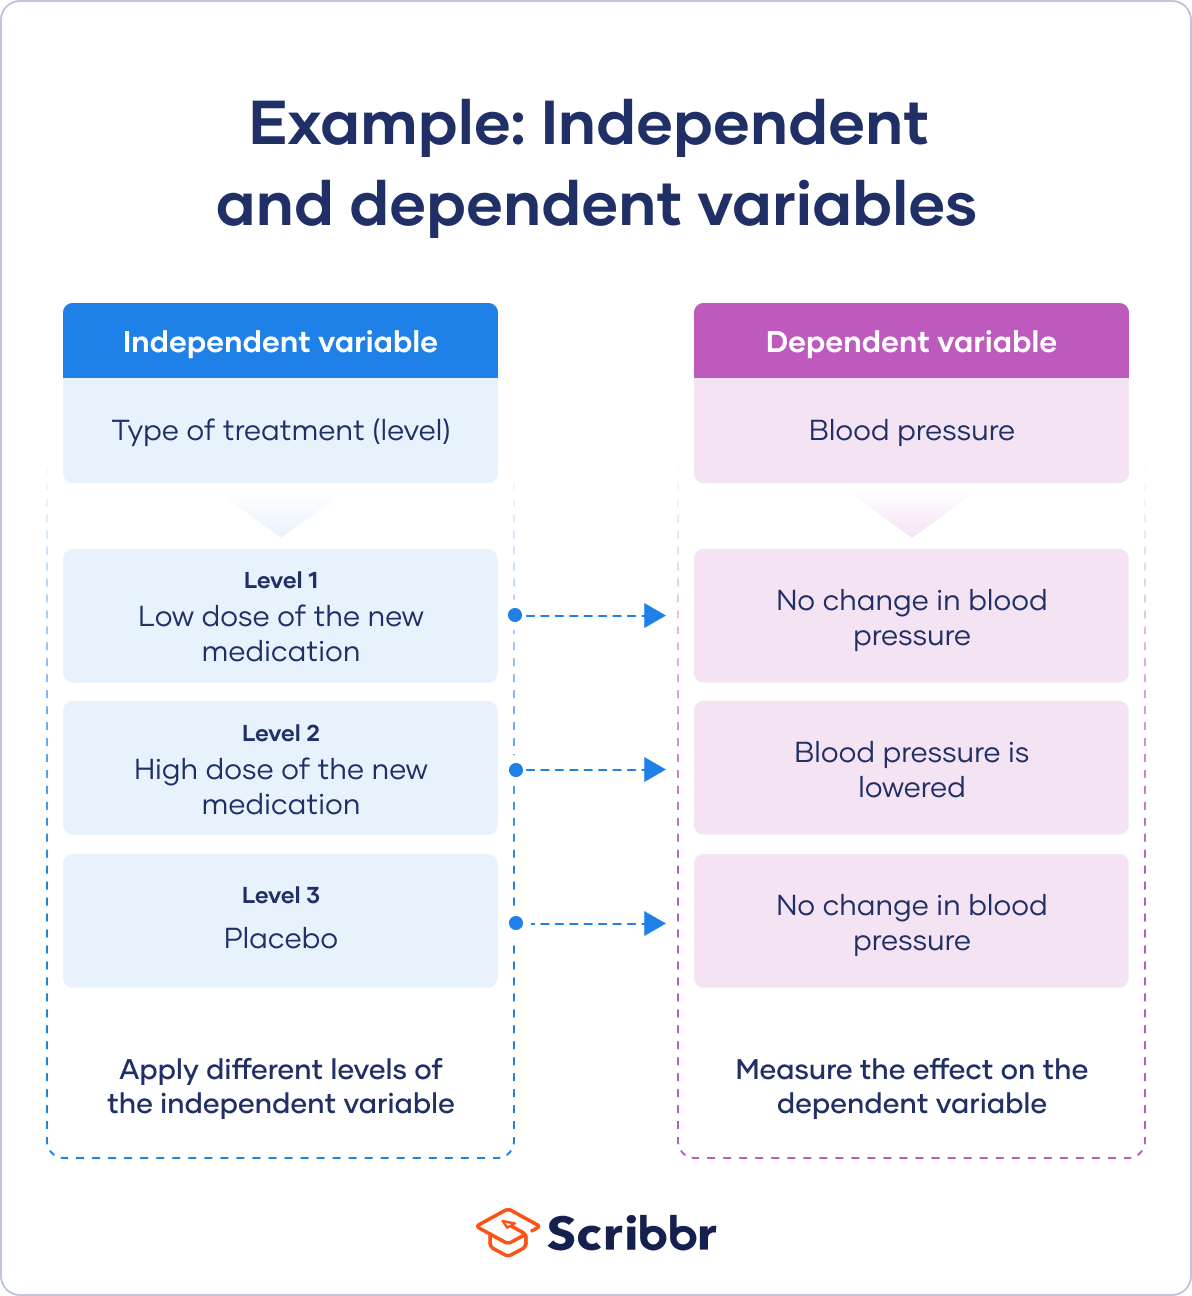
Let's look at a classic clinical research scenario. A researcher wants to test if a new drug lowers blood pressure.
- The treatment (the new drug vs. a placebo) is what is being manipulated. It's the presumed cause. This is the independent variable.
- The blood pressure is what is being measured to see if it changes. It's the outcome. This is the dependent variable.
The image below perfectly illustrates this dynamic. The "Type of treatment" is the independent variable, which is applied at different "levels" (low dose, high dose, placebo). The resulting "Blood pressure" is the dependent variable, which is measured to determine the effect.
Formalizing the Concepts in a Medical Context
To build on this intuition, let's turn to a formal definition from a paper written for medical students and researchers. This will give you the precise language used in academic settings.
A Student's Guide to the Classification and Operationalization ...
This article from the Indian Journal of Psychological Medicine provides clear, clinically relevant definitions that are directly applicable to the research you'll encounter.
First, read the brief introductory paragraphs under the heading Variables for context. Then, focus on the core definitions in the section Independent and Dependent Variables. Pay close attention to the examples provided, such as the risk factors for myocardial infarction. Note the important distinction it makes between association and causation. Finally, read the section beginning with "As a side note". This highlights a crucial point: a variable's role as independent or dependent is not fixed but is determined by the specific research question.
From Research Question to Variables
As the article mentions, the first step in designing a study or analysis plan is to clearly identify the independent and dependent variables from the research question. The table below gives you a few more examples to help solidify your understanding.

Notice in the first row that the independent variable is the "Increase or decrease of salt content" and the dependent variable is the "Blood pressure level". The research question investigates the effect of salt intake (the cause/IV) on blood pressure (the effect/DV).
For a more active learning experience, the following video from Medicosis Perfectionalis (a channel you've seen before) offers an excellent, medically-oriented walkthrough.
Statistics- Dependent variable vs. Independent variable - Cause and Effect - Correlation
This video uses a memorable "cause and effect" framework and quiz-style questions to reinforce the concepts.
Watch the following segments: The initial explanation using the example of studying hours and test scores: Cause and Effect. The explanation of how variables are plotted on a graph, which is a universal convention: Plotting on X and Y axes. The independent variable (cause) always goes on the x-axis, and the dependent variable (effect) goes on the y-axis. The crucial distinction between correlation and causation: Correlation vs. Causation. This is one of the most important principles in statistics. Finally, test yourself with the quiz question at the end about smoking and lung cancer: Quiz Time.
As the video and reading material emphasize, identifying an independent and dependent variable is a way of hypothesizing a causal relationship. However, your statistical test may only be able to show an association or correlation. Proving causation requires a rigorous study design, a topic we'll explore soon.
A Practical Guide to Identifying Variables
When you are presented with a research protocol or a client's project, the variables won't always be neatly labeled. Here's a simple method to identify them:
- Frame the core research objective as a single question. For example, "A study will assess the efficacy of drug A compared to placebo in reducing seizure frequency in patients with epilepsy." The question is: "Does Drug A reduce seizure frequency more than a placebo?"
- Identify the 'cause' or intervention. What is being manipulated or compared? In this case, it's the type of treatment (Drug A vs. placebo). This is your independent variable.
- Identify the 'effect' or outcome. What is being measured to see if it changed? Here, it's the seizure frequency. This is your dependent variable.
Let's apply this logic with a guide that breaks it down even further.
Independent vs Dependent: Definitions & Examples
This article from Researcher.Life provides a very practical, step-by-step approach.
Read the section How to identify. This provides a clear, actionable strategy. Then, read the important point made in FAQ #3 about non-experimental research. This is highly relevant to medicine, where you often observe relationships (e.g., between smoking and lung cancer) rather than conducting an experiment where you would assign people to a smoking group. The IV/DV classification still applies.
Conclusion
You have now completed the foundational framework for understanding variables in a research context. You can classify them by type (what they are) and by role (what they do).
Here are the key takeaways from this lesson:
- The independent variable (IV) is the presumed cause, predictor, or exposure.
- The dependent variable (DV) is the measured effect, outcome, or response.
- To identify them, rephrase the research topic as a cause-and-effect question.
- The role of a variable depends entirely on the research question; 'patient satisfaction' could be a DV in one study and an IV in another.
- Graphically, the IV is plotted on the x-axis and the DV is on the y-axis.
- Identifying IVs and DVs is about testing a hypothesized relationship. It does not automatically prove causation.
With this knowledge, you are now prepared to understand how different study designs are structured. In our next lesson, we will explore the common study designs used in medical research—such as randomized controlled trials (RCTs), cohort studies, and case-control studies. You will see that each design is simply a different strategy for examining the relationship between independent and dependent variables.