Hello. Last lesson distinguished a measured summer decline from slower growth and from a widening gap between groups. It also showed that different assessments can produce strikingly different estimates for the same grade band. This lesson examines three reasons a summer-loss claim may be more or less credible: the score scale, the dates used to define summer, and the students included in the analysis. These checks matter before using a reported decline to argue for a different school calendar.
The scale determines what a “drop” measures
Recall the chart from last lesson. Its bars express estimated summer changes in standard deviations, yet the estimates differ substantially across assessments.
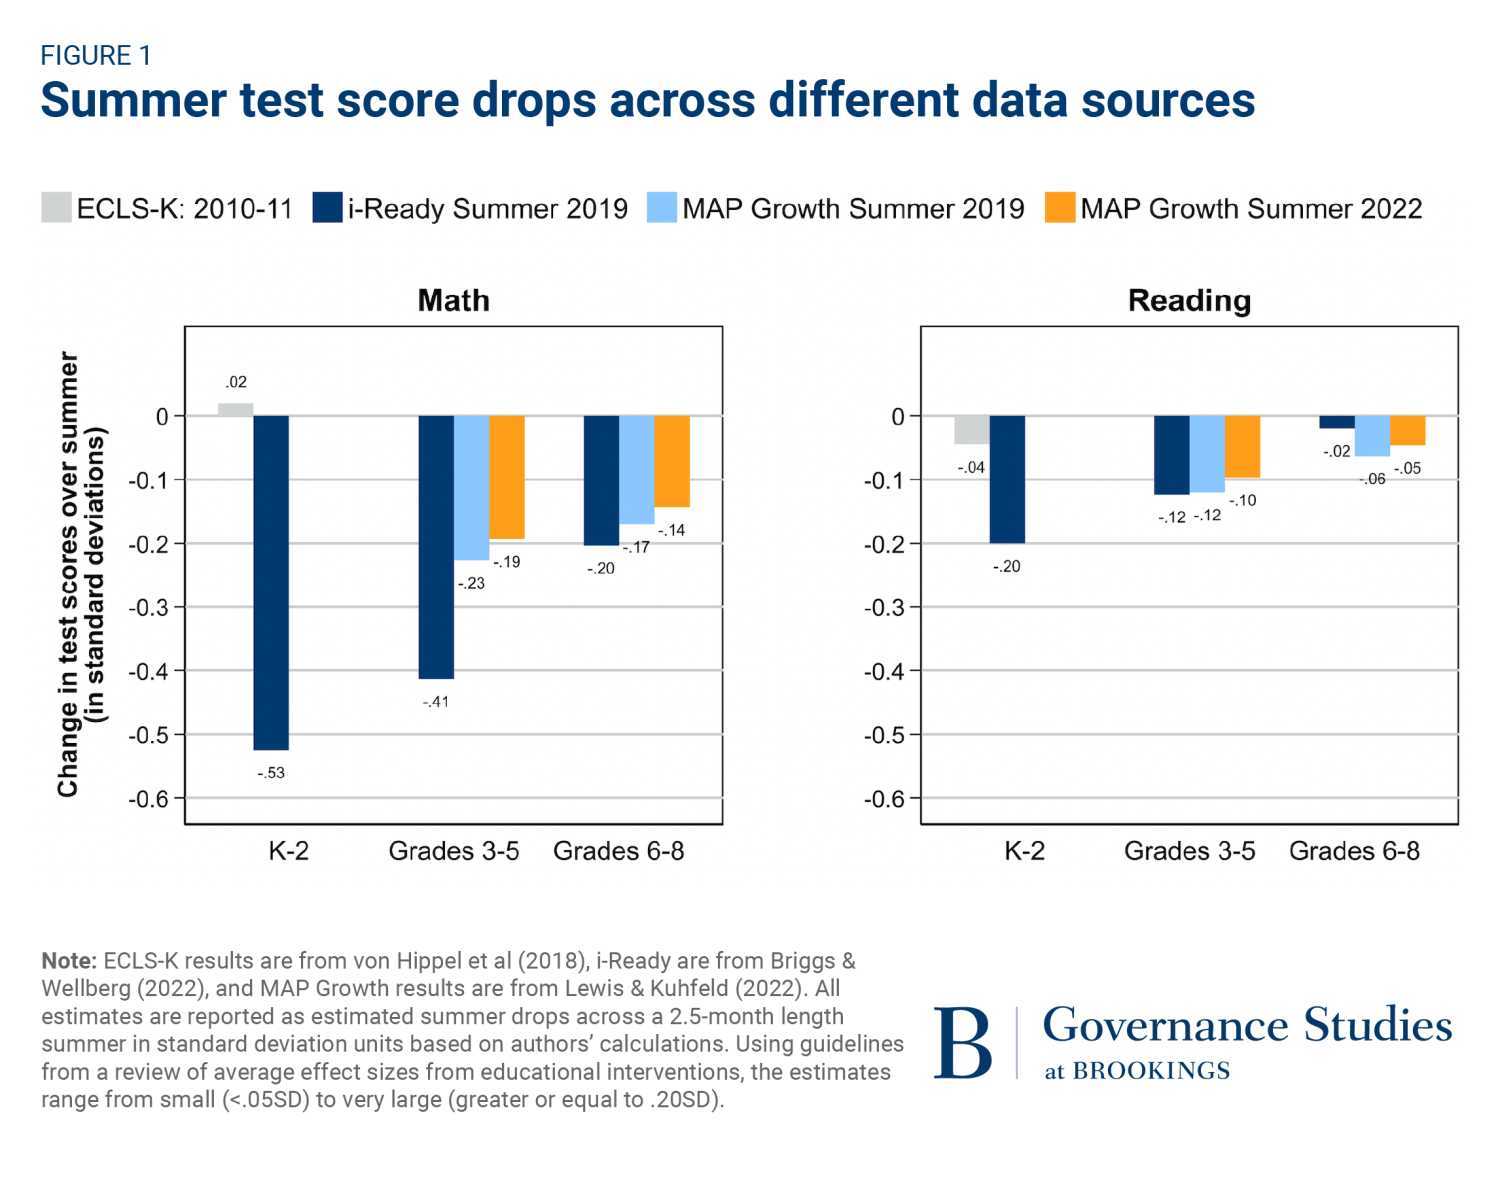
A standard deviation describes variation in scores on a particular scale. Expressing changes in these units helps put estimates in context, but it does not make different tests identical measures of learning. The tests may cover different material, include different students, or turn answers into scores differently. Nor can a change of standard deviations be translated automatically into a fixed number of “months of learning.”
The scoring issue goes deeper than choosing units. If a test reports the percentage of questions answered correctly, its measured gap can change when the questions change, even if students’ skills do not. Suppose two groups average 6 and 8 correct answers out of 10: their scores differ by 20 percentage points. Add 10 questions that everyone can answer, and their scores become 16 and 18 out of 20. The measured gap is now 10 percentage points, although nobody’s ability changed. Comparing growth across grades therefore requires a scale designed to make scores meaningful across changing questions and difficulty levels.
Read the historical comparison and the explanation of scoring in this article.
Read the Education Next article by Paul von Hippel to see why a frequently cited finding about summer achievement gaps needs careful interpretation.
On printed pp. 11–12, in “A classic result fails to replicate,” read the comparison from the description of the older study through the newer national study. Then, on pp. 12–13 under “The fun-house mirror of 1980s test scores,” read the scoring explanation. Focus on why changing a scoring method can change the measured distance between students, not just the label attached to a score.
The older study’s summer-gap finding came from a relatively small group of children in one school system, tested decades ago. The newer data described in the article do not reproduce that pattern. This does not prove that summer never affects learning. It does mean that an emphatic claim such as “most achievement-gap growth happens in summer” depends heavily on which evidence and measurement method support it.
A useful distinction is between changing units and changing how performance maps onto the scale. Multiplying every score by the same number changes the numerical size of every gap but not whether a gap widened. A scoring method that stretches some parts of the achievement range more than others can change the apparent pattern of gap growth. Modern item-response methods account for question difficulty more carefully than a simple percentage-correct score, but no scoring method eliminates every measurement concern.
The dates determine which days count as “summer”
A spring test is not necessarily taken on the last day of school, nor a fall test on the first day back. A spring-to-fall difference can therefore include weeks of instruction at both ends. Calling the entire interval “summer” assigns school-time learning to the break.
Consider a simplified case. A student scores 100 on a test taken three weeks before school ends and 103 on a test taken three weeks after the next term starts. The observed spring-to-fall change is positive 3. If scores rose by roughly one point per week during those six weeks in school, the estimated score at the end of the first term would be 103 and at the beginning of the next term would be 100. Under that assumption, the estimated break-time change would be negative 3. The observed scores have not changed; only the estimated boundaries of the period have.
The following paper shows how researchers addressed this problem using test dates and school-calendar dates.
[PDF] The Role of Summers in Understanding Achievement Disparities
Read the paper’s account of why the interval between tests is not necessarily the interval out of school, and how its authors estimated scores at the actual school-year boundaries.
In “Adjustments to NWEA RIT Scores” (printed pp. 11–12), begin with the date adjustment. Continue through the discussion of Figure 2. Pay particular attention to the distinction between observed test scores and projected scores on the last and first days of school, and to the authors’ warning that a small adjustment to scores can substantially change an estimated summer gain or loss.
Correcting the dates improves the match between the estimate and the period being studied, but it introduces an assumption: the projection uses a school-year learning rate to estimate scores on days when students were not tested. The paper reports that its projected and observed scores are highly correlated. That is reassuring for predicting score levels, but a summer change is often small compared with those levels. Even a small projection difference can materially change the estimated change. A credible report should state its testing window, how it locates the start and end of the break, and whether its conclusion survives reasonable alternative date adjustments.
There is a related comparability issue when students take a different test form after moving up a grade. A change in scores may reflect imperfect alignment between forms as well as learning. The earlier article explains both this older problem and why newer adaptive tests help without guaranteeing identical findings across assessments.
Return to von Hippel’s article for the distinction between measuring a student twice on comparable questions and comparing scores across grade-level test forms.
On printed p. 13, under “Measuring summer learning: from one fun-house mirror to another,” read the test-form comparison. Then, under “Are we still in the fun house?” on pp. 13–14, read the modern-test comparison. Focus on why two adaptive, carefully scored assessments can still yield different estimates.
The lesson is not that older findings must be rejected or newer tests accepted without question. It is that a summer estimate is a comparison across time. The scores must be comparable across those dates, and the dates must correspond reasonably well to the period the claim names.
The sample determines whose summer is represented
Even a well-scaled, well-timed test can support an overbroad conclusion if the students studied do not represent the students named in the claim. The historical study above is informative about its participants; by itself, it cannot establish what typically happens across all students today. A much larger dataset may cover many kinds of schools while still differing from the wider student population.
There is also a tension between comparing the same students over time and retaining as many students as possible. Imagine two students with spring scores of 80 and 60. If each scores five points lower in fall, both declined. But if only the first student has a recorded fall score, the available spring average is 70 while the available fall average is 75—an apparent rise caused by a change in who was counted. Matching students across dates prevents that particular error. Requiring students to have every test score across several grades, however, excludes anyone with a missing score, and those retained may differ from those excluded.
Read how the paper weighs this tradeoff.
[PDF] The Role of Summers in Understanding Achievement Disparities
Read the paper’s description of which students enter its main analysis and how those students compare with a broader public-school population.
In “Analytic Sample” (printed pp. 12–14), read the inclusion rules, including the comparison between the complete-score panel and a less restrictive sample. Then read the discussion following Table 1, from the population comparison. Focus on why a large sample and a nationally representative sample are not necessarily the same thing.
The paper’s complete-score sample protects against mistaking changes in the mix of students for changes in their learning. Its less restrictive analysis includes more students and provides a check on whether that selection drives the main result. The authors also compare their sample with the wider public-school population rather than assuming that size alone guarantees representativeness. In particular, school-level measures of poverty cannot establish how summer outcomes differ by individual students’ family incomes.
Putting the three checks together
When assessing a summer learning loss claim, first pin down its scope: which students, which subject, which summers, and what kind of loss? Then inspect the evidence along three dimensions:
| Check | Stronger evidence makes clear… | A warning sign |
|---|---|---|
| Scale | How scores are made comparable across grades and dates, and how sensitive findings are to scoring choices | A precise claim about lost skills or widening gaps rests only on a scale whose comparability is unclear |
| Dates | When tests occurred relative to the actual break and how any boundary-day scores were estimated | The full spring-to-fall test interval is treated as time out of school |
| Sample | Which students were included, who was excluded, and how broadly the results can be generalized | A finding from a narrow or changing set of students is stated as true for all students |
These checks need not yield an all-or-nothing verdict. Multiple sources can provide credible evidence that some measured summer declines occur, while leaving the size, prevalence, or distribution across groups uncertain. Disagreement between assessments is itself useful information about that uncertainty. Most importantly for the calendar debate, evidence of summer loss does not yet show that rescheduling the same instructional days improves learning over a full year.
Takeaways
A summer-loss estimate depends on more than the height of a bar. Its scale governs what a score difference means; its testing dates govern which school and break days enter the estimate; and its sample governs whose experience the estimate describes. Confidence increases when researchers explain these choices and show that their main conclusion holds under reasonable alternatives.
Next, the course turns from measuring summer outcomes to evaluating calendar studies: whether their apparent effects come from rescheduling days, adding instruction during breaks, or differences between the schools being compared.