Hello! Welcome to the first lesson in our new module on debugging multithreaded programs.
In the last module, we explored the complexities of lock-free programming and the infamous ABA problem. A key takeaway was that concurrency bugs can be incredibly subtle and difficult to reproduce, making robust debugging skills essential. This lesson marks our transition from writing concurrent code to diagnosing it when it goes wrong.
Our goal today is to master the foundational GDB commands for working with threads. You will learn how to get a high-level overview of a program's threaded state, switch your focus between individual threads, and inspect their call stacks. This is the first and most critical step in untangling any multithreaded mystery, from simple hangs to complex data corruption.
A Practical Scenario: The Runaway Thread
The best way to learn a debugger is to use it on a broken program. We're going to start with a classic and frustrating scenario: a program that is consuming 100% of a CPU core for no apparent reason.
We'll use an excellent, self-contained example from an article on Medium. First, let's get the code.
Get Owned by Multithreaded C Debugging or Own It with ...
This article, 'Get Owned by Multithreaded C Debugging or Own It with GDB,' provides the perfect case study. For now, we only need to set up the environment.
Follow the instructions under the 'Thread Digger' section. First, use git clone to get the source code. Then, run make to compile test.out. Finally, run ./test.out 1 to start the program. Leave it running.
With the program running, open a new terminal. You won't see any output, but as the article points out, something is wrong. Let's use top to investigate.
- Run
topin your new terminal. You should seetest.outat or near the top of the list, consuming close to 100% CPU. Note its Process ID (PID). - Press
qto exittop. - Now, run
top -H -p <PID>, replacing<PID>with the process ID you just noted. The-Hflag tellstopto show individual threads.
You'll see a list of threads within your process. One of them will be consuming 99.9% CPU, while the others are idle. The ID shown in the PID column for this runaway thread is actually its Lightweight Process (LWP) ID. This OS-level identifier is our first clue.
Attaching GDB and Finding Your Thread
Now that we've identified the problematic process and thread from the outside, it's time to go inside with GDB. We can attach the debugger directly to the already-running process.
In the same terminal, run sudo gdb ./test.out <PID>. You may need to enter your password. GDB will attach to the process and halt all of its threads.
Our first command inside GDB is the most important one for multithreaded debugging: info threads.
(gdb) info threads
This command lists all threads in the program.
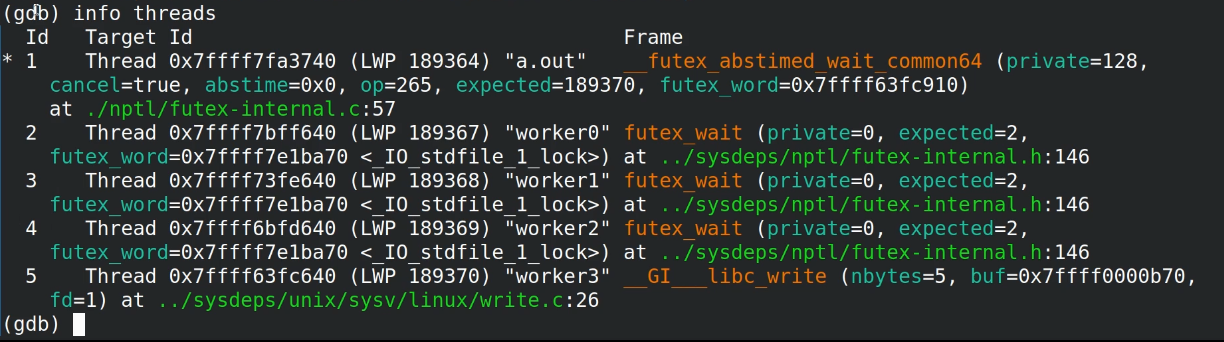
Look at the output in your own GDB session. You will see several columns:
- ID: GDB's internal ID for the thread. This is the number you'll use in other GDB commands. An asterisk
*marks the currently active thread. - Target ID: This shows the system-level details, including the
LWPID we found withtop -H. - Frame: This tells you where the thread is currently paused—its current function and line number.
Your task: Match the LWP ID of the runaway thread from top -H to the Target Id column in info threads. This tells you which GDB thread ID (the number in the first column) corresponds to your CPU-hungry thread.
Switching Contexts and Inspecting State
The info threads output from the example program likely shows one thread spinning in thread_func while the others are sleeping in __GI___clock_nanosleep. Let's focus on the busy thread.
To switch GDB's context to a different thread, use the thread command with its GDB ID. For example, if the runaway thread is ID 6:
(gdb) thread 6
Switching to thread 6 (Thread 0x7913a75fa6c0 (LWP 45748) "test.out")
#0  0x00000000004011b0 in thread_func (p=0x3c75a8e0) at main.c:27
27	        while(val) {}
GDB confirms the switch and shows you the current stack frame for that thread.
Now that we are "in" the context of the problematic thread, we can use standard GDB commands to investigate:
bt(orbacktrace): Shows the complete call stack for the current thread.info locals: Displays the values of local variables in the current stack frame.p <variable>(orprint <variable>): Prints the value of a specific variable.
In the test.out example, running bt on the busy thread will show it's in thread_func. Using info locals will reveal the variables inside that function, and you'll likely see that val is non-zero, causing the while(val) loop to spin forever. This pinpoints the bug.
This process—identify, attach, list, switch, inspect—is the fundamental workflow for debugging threads in GDB.
To learn more about the core commands from a different perspective, the following video provides a concise and clear demonstration.
Debugging with Multiple Threads (gdb, pthreads)
This video, 'Debugging with Multiple Threads,' by Jacob Sorber, quickly covers the essential commands we've just discussed and introduces another powerful one.
Watch the following segments: 1:37 - 2:20: This covers info threads and thread <ID>, reinforcing what we just did. 4:00 - 4:46: This introduces a very powerful command, thread apply all bt, which shows the backtrace for every single thread at once. This is incredibly useful for getting a snapshot of the entire program's state, especially when diagnosing deadlocks.
Controlling the Chaos: The Scheduler Lock
By default, when you step through code (e.g., with next or step), GDB only controls the current thread. All other threads are allowed to run freely in the background. This can be chaotic; shared data can change under your feet, making it impossible to reason about the program's state.
To solve this, GDB provides the scheduler-locking feature.
Debugging multithreaded code with GDB: thread names
The video 'Debugging multithreaded code with GDB: thread names' from Undo explains this concept and its important trade-offs perfectly.
Please watch from 4:33 to 9:41. Pay close attention to: The default behavior (4:33 - 7:10): See how other threads continue to run and modify shared data while one thread is being stepped. set scheduler-locking on (7:10 - 9:41): Understand how this command freezes all other threads. Crucially, absorb the warning about how this can cause a deadlock if a frozen thread holds a lock that your active thread needs.
The three modes for scheduler-locking are:
off(default): Only the current thread is held, others run freely.on: Only the current thread is allowed to run. All other threads are frozen. This is perfect for isolating a thread's logic but risky if threads share locks.step: A hybrid. Other threads are frozen duringnext,step, etc., but run freely during commands likecontinue. This is often a safe and useful compromise.
Knowing how to lock the scheduler is an advanced GDB skill that gives you precise control when debugging complex interactions.
Test your understanding!
You are debugging a program that has hung. You attach GDB and info threads shows that Thread 4 is stopped inside a call to calculate_data() and Thread 7 is stopped inside pthread_mutex_lock().
You hypothesize that Thread 4 is holding a mutex that Thread 7 is waiting for, but Thread 4 is stuck in an infinite loop and will never release it.
What sequence of GDB commands would you use to investigate this? Describe your steps and which command you'd use for each.
Show answer
Here is a logical sequence of commands to diagnose the issue:
-
Get a full picture: First, see what every thread is doing to confirm the high-level state.
(gdb) thread apply all btThis will show the full call stack for all threads. You would examine the backtrace for Thread 7 to see which function called
pthread_mutex_lock, and the backtrace for Thread 4 to confirm it's incalculate_data(). -
Focus on the suspect: Switch to the thread you believe is causing the problem (the one holding the lock).
(gdb) thread 4 -
Isolate and step: To safely debug the loop in
calculate_data()without other threads interfering, lock the scheduler. Then, you can usenextto step through the code line-by-line to find the infinite loop.(gdb) set scheduler-locking on (gdb) next (gdb) next ...
This approach allows you to confirm the global state, then zoom in on the specific problem area while freezing the rest of the program for a stable debugging environment.
Conclusion
Congratulations! You have just learned the foundational toolset for debugging multithreaded C programs. While these commands are simple, they are incredibly powerful and form the basis of all advanced debugging techniques.
Key Takeaways:
- You can identify problematic threads from outside your program using tools like
top -Hto find their LWP ID. info threadsis your main dashboard in GDB, listing all threads and mapping OS LWP IDs to GDB's internal IDs.- You can switch GDB's focus using
thread <ID>and then use standard commands likebtandprintto inspect that specific thread's state. thread apply all btgives you a complete snapshot of the program by showing the call stack for every thread at once.set scheduler-locking ongives you fine-grained control, allowing you to debug one thread in isolation by freezing all others.
Preview of the Next Lesson:
Now that you can see what threads are doing, the next logical step is to control where they stop. In the next lesson, we will learn how to set thread-specific breakpoints and navigate between thread backtraces in GDB to diagnose hangs, allowing you to precisely target and halt execution to capture the state you need to examine.