Hello! Welcome back to our module on debugging multithreaded programs.
In the previous lesson, we established the foundational GDB workflow: attaching to a process, listing threads with info threads, switching between them with thread <ID>, and getting a global snapshot with thread apply all bt. We also saw how set scheduler-locking on can give us fine-grained control over thread execution.
Today, we will build directly on those skills to achieve a more precise level of control. Our learning outcome is to set thread-specific breakpoints and navigate between thread backtraces in GDB to diagnose hangs. This technique is indispensable when you need to investigate the behavior of one particular thread without being interrupted by others, a common requirement when debugging deadlocks and other synchronization nightmares.
Why Thread-Specific Breakpoints?
Imagine a program with one "writer" thread and dozens of "reader" threads all accessing the same function. If you set a normal breakpoint in that function, GDB will halt every time any thread hits it, creating a lot of noise. A thread-specific breakpoint allows you to say, "Only stop when the writer thread gets here." This surgical precision is key to efficient debugging.
The GDB syntax is a simple extension of the break command you already know. Let's see how it works.
Debugging multithreaded programs in GDB
The article 'Debugging multithreaded programs in GDB' from Undo.io provides a concise explanation of this command.
Read the short section titled 'Setting a breakpoint in GDB'. It demonstrates the syntax b <line_number> thread <thread_id>. Note how the program continues until that specific thread hits the breakpoint.
The key command is break <location> thread <thread_id>, where <location> can be a line number (e.g., main.c:42) or a function name.
This video from Jacob Sorber also covers the same command, reinforcing the concept.
Debugging with Multiple Threads (gdb, pthreads)
This clip from 'Debugging with Multiple Threads' shows the thread-specific breakpoint command in action.
Watch the very brief segment from 3:53 to 4:08. It clearly states the syntax for setting a breakpoint that applies only to a single thread.
Here is a visual example of what you see in GDB when a thread-specific breakpoint is hit.

Diagnosing a Hang: A Practical Walkthrough
Now, let's apply these concepts to a classic multithreaded bug: a deadlock. We'll create a program that is guaranteed to hang, and then use our GDB skills to diagnose exactly why it's stuck.
Here is a simple C program where two threads attempt to acquire two mutexes in a conflicting order, causing a deadlock.
// deadlock.c
#include <stdio.h>
#include <pthread.h>
#include <unistd.h>

pthread_mutex_t mutex1 = PTHREAD_MUTEX_INITIALIZER;
pthread_mutex_t mutex2 = PTHREAD_MUTEX_INITIALIZER;

void* thread1_func(void* arg) {
    printf("Thread 1: Trying to lock mutex1...\n");
    pthread_mutex_lock(&mutex1);
    printf("Thread 1: Locked mutex1.\n");

    // Give thread 2 a chance to run and lock mutex2
    sleep(1);

    printf("Thread 1: Trying to lock mutex2...\n");
    pthread_mutex_lock(&mutex2);
    printf("Thread 1: Locked mutex2.\n");

    pthread_mutex_unlock(&mutex2);
    pthread_mutex_unlock(&mutex1);
    return NULL;
}

void* thread2_func(void* arg) {
    printf("Thread 2: Trying to lock mutex2...\n");
    pthread_mutex_lock(&mutex2);
    printf("Thread 2: Locked mutex2.\n");

    // Give thread 1 a chance to run and lock mutex1
    sleep(1);

    printf("Thread 2: Trying to lock mutex1...\n");
    pthread_mutex_lock(&mutex1);
    printf("Thread 2: Locked mutex1.\n");

    pthread_mutex_unlock(&mutex1);
    pthread_mutex_unlock(&mutex2);
    return NULL;
}

int main() {
    pthread_t t1, t2;

    pthread_create(&t1, NULL, thread1_func, NULL);
    pthread_create(&t2, NULL, thread2_func, NULL);

    pthread_join(t1, NULL);
    pthread_join(t2, NULL);

    printf("Finished.\n");
    return 0;
}
-
Compile and Run: Save this code as
deadlock.c. Compile it with debugging symbols and the pthreads library:gcc -g -o deadlock deadlock.c -pthread -
Observe the Hang: Run
./deadlock. You will see output indicating both threads have locked one mutex, but the program will then hang indefinitely. -
Debug with GDB:
- Start the program in GDB:
gdb ./deadlock - Type
runand press Enter. The program will run and hang as before. - Press
Ctrl-Cto interrupt the program and return control to GDB.
- Start the program in GDB:
-
Diagnose the Hang: Now we execute the core diagnostic pattern we discussed.
- First, get a snapshot of all threads:
thread apply all bt
- First, get a snapshot of all threads:
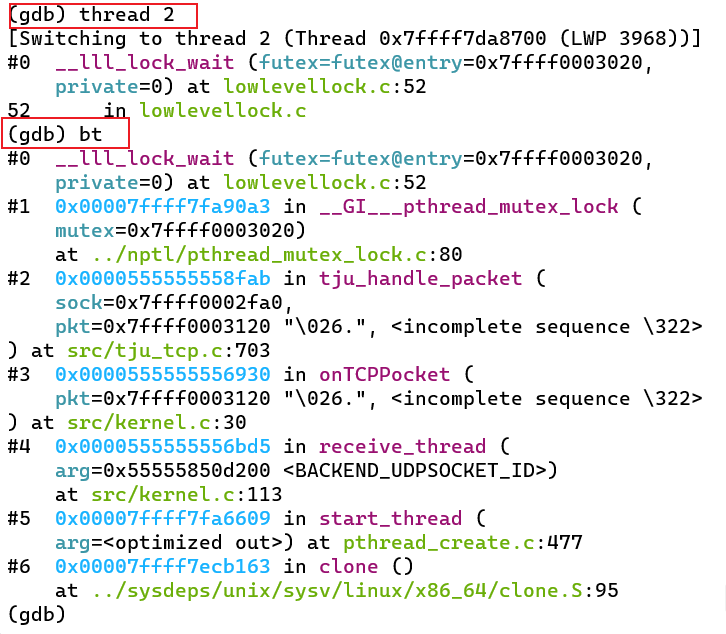
You should see an output where one thread is stuck in pthread_mutex_lock trying to get mutex2, and the other is also stuck in pthread_mutex_lock trying to get mutex1. The backtraces (bt) clearly show the line numbers in deadlock.c where they are blocked. This output is the "smoking gun" for a deadlock.
Navigating Between Backtraces
The thread apply all bt command gives you the global view. To "navigate between backtraces," you simply switch to each thread involved and inspect its context more closely.
- Use
info threadsto get the GDB IDs forthread1_funcandthread2_func. - Switch to the first thread:
thread <ID_of_thread1> - Examine its stack in detail:
bt. The backtrace will show it's blocked onpthread_mutex_lockwaiting formutex2. - Switch to the second thread:
thread <ID_of_thread2> - Examine its stack:
bt. This will show it's blocked waiting formutex1.
By switching between the threads and looking at their individual call stacks, you have effectively navigated the dependency chain of the deadlock and confirmed the root cause. You can now use this information to fix the code (e.g., by enforcing a consistent lock acquisition order).
Test your understanding!
In our deadlock.c example, you suspect Thread 2 is the problem. You want to let the program run but stop it only when Thread 2 attempts to lock its second mutex (mutex1). Assuming GDB has assigned Thread 2 an ID of 3, and the call is on line 32, what single command would you use?
Show answer
The correct command is:break deadlock.c:32 thread 3
This sets a breakpoint at line 32 that will only be triggered by thread 3, ignoring any other thread that might execute code on that line (not applicable here, but crucial in more complex programs).
Advanced Insight: Scheduler Locking and Deadlocks
In the previous lesson, we learned about set scheduler-locking on. This command freezes all other threads, which is great for isolating one thread's logic. However, it comes with a major caveat: you can accidentally cause a deadlock within the debugger.
This video provides a brilliant demonstration of this exact scenario and how to diagnose it using the techniques we've just practiced.
How to debug Linux multi threaded code - Greg Law - Meeting C++ 2024
In 'How to debug Linux multi threaded code,' Greg Law demonstrates what happens when scheduler-locking on causes a problem and how thread apply all backtrace saves the day.
Watch from 32:38 to 35:22. The speaker sets scheduler-locking on and then tries to step. The program hangs. He immediately realizes another thread must hold a lock his current thread needs and uses thread apply all backtrace to instantly identify which thread has the lock and where.
This scenario highlights the power and synergy of these commands. set scheduler-locking gives you control, but thread apply all bt is your essential tool for understanding the global state, especially when that control leads to unintended consequences like a debugger-induced hang.
Conclusion
You have now moved beyond basic inspection and into surgical control of multithreaded programs in GDB. Being able to set breakpoints on specific threads and quickly analyze the state of all threads in a hung program are indispensable skills for tackling complex concurrency bugs.
Key Takeaways:
- Use
break <location> thread <thread_id>to set breakpoints that only stop a specific thread. - The primary diagnostic pattern for a hung program is:
Ctrl-C->thread apply all bt. - Navigating between backtraces involves using
thread <ID>to switch contexts andbtto inspect the call stack of each relevant thread, revealing the chain of dependencies causing the hang. - Be mindful that
set scheduler-locking oncan cause its own deadlocks, which you can then diagnose withthread apply all bt.
Preview of the Next Lesson:
Manually hunting for deadlocks and race conditions works, but it can be slow and requires you to know where to look. In our next lesson, we will explore Valgrind's Helgrind tool, a dynamic analysis tool that can automatically detect data races and other synchronization errors in your C program, often without any manual debugging effort.