Hello! Welcome back to our course on C threads.
In our last lesson, we took a manual approach to debugging, using GDB to surgically inspect a hung program, set thread-specific breakpoints, and analyze backtraces to diagnose a deadlock. While powerful, that method requires you to know that a problem exists and where to start looking. Today, we shift gears to an automated approach.
Our goal is to use Valgrind's Helgrind tool to automatically detect data races in a C program. Data races are one of the most common and insidious types of concurrency bugs. They occur when multiple threads access a shared piece of data without proper synchronization, and at least one of those accesses is a write. The result is often unpredictable behavior that is notoriously hard to reproduce. Tools like Helgrind can save you hours of manual debugging by finding these issues for you.
What is Helgrind?
You might already be familiar with Valgrind's memcheck tool for finding memory leaks and invalid memory access. Valgrind is actually a suite of dynamic analysis tools, and Helgrind is its specialized tool for detecting synchronization errors in multithreaded programs.
Helgrind runs your compiled program in a virtual environment, monitoring how your threads interact with memory and synchronization primitives (like mutexes). It doesn't just wait for a crash; it proactively looks for dangerous patterns.
To understand its capabilities, please read this brief overview.
Helgrind: Detecting Synchronisation Issues in ...
The article 'Helgrind: Detecting Synchronisation Issues in Multithreaded Programs' from OpenSourceForU gives an excellent summary of what Helgrind does.
Read the section titled 'Overview of Helgrind'. It outlines the three main categories of errors Helgrind can detect. For today's lesson, we are focused on the second category: race conditions.
As the article states, Helgrind detects:
- Incorrect use of POSIX pthread APIs: Such as unlocking a mutex that was never locked.
- Data Races: Accessing shared memory from multiple threads without locks.
- Potential Deadlocks: Analyzing the order in which locks are acquired to find risky patterns.
Today, our entire focus is on the second point: detecting data races.
Your First Race Detection with Helgrind
Let's see Helgrind in action. We'll start with a very simple program containing a blatant data race.
Using Helgrind to debug data races - Undo.io
The article 'Using Helgrind to debug data races' from Undo.io provides a perfect first example. It contains a simple C program with a data race, the command to run Helgrind, and a clear explanation of the output.
Please read the section 'Debugging Basic Data Races with Helgrind'. Compile the C code as shown (gcc -g -lpthread race.c). The -g flag is important as it includes debugging symbols, which allows Helgrind to give you precise file and line numbers. Then, run it with the specified Valgrind command and analyze the output.
The process you just followed is the core workflow for using Helgrind:
- Compile with
-g: Include debug symbols. Notice you don't need any special threading flags beyond what's needed to compile the program itself. - Run with Valgrind: Execute your program via
valgrind --tool=helgrind ./your_program_name. - Interpret the Report: Helgrind produces a detailed report for each potential issue.
Let's break down the report's key components, which are also visible in the screenshot below.
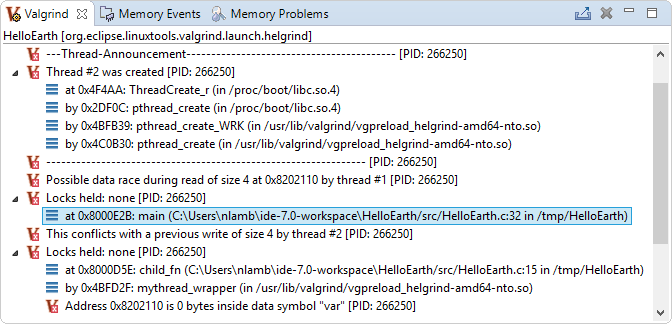
The report tells you everything you need to know:
- What happened: A data race.
- Where it happened: At a specific memory address.
- Who was involved: The thread IDs of the conflicting threads.
- How it happened: The exact lines of code and the call stacks leading to the conflicting accesses.
Helgrind in Practice: Fixing a Racy Counter
Now let's apply this to a more practical and common scenario: a shared counter being incremented by multiple threads. This is a classic example because the increment operation (counter++) looks atomic in code but is not. It's actually a three-step read-modify-write sequence:
- Read the current value of
counterfrom memory into a CPU register. - Increment the value in the register.
- Write the new value from the register back to memory.
A data race occurs if another thread accesses counter between these steps.
Consider the following program:
// counter_race.c
#include <pthread.h>
#include <stdio.h>
#include <stdlib.h>

#define NUM_THREADS 4
#define NUM_INCREMENTS 100000

long long counter = 0;

void* worker(void* arg) {
    for (int i = 0; i < NUM_INCREMENTS; i++) {
        counter++; // DATA RACE!
    }
    return NULL;
}

int main() {
    pthread_t threads[NUM_THREADS];
    for (int i = 0; i < NUM_THREADS; i++) {
        pthread_create(&threads[i], NULL, worker, NULL);
    }
    for (int i = 0; i < NUM_THREADS; i++) {
        pthread_join(threads[i], NULL);
    }

    long long expected = (long long)NUM_THREADS * NUM_INCREMENTS;
    printf("Expected counter value: %lld\n", expected);
    printf("Actual counter value:   %lld\n", counter);

    if (counter != expected) {
        printf("The race condition was observed!\n");
    }

    return 0;
}
- Compile and Run:
gcc -g -o counter_race counter_race.c -pthreadthen./counter_race. You'll almost certainly see that the actual value is less than the expected value. This is the race condition in action. - Detect with Helgrind: Now run
valgrind --tool=helgrind ./counter_race. Helgrind will output a clear data race report, identifying thecounter++line as the source of conflict between the worker threads.
To fix this, we must ensure the read-modify-write sequence is atomic by protecting it with a mutex.
// counter_fixed.c
#include <pthread.h>
#include <stdio.h>
#include <stdlib.h>

#define NUM_THREADS 4
#define NUM_INCREMENTS 100000

long long counter = 0;
pthread_mutex_t lock = PTHREAD_MUTEX_INITIALIZER; // Initialize a mutex

void* worker(void* arg) {
    for (int i = 0; i < NUM_INCREMENTS; i++) {
        pthread_mutex_lock(&lock);
        counter++; // Critical section
        pthread_mutex_unlock(&lock);
    }
    return NULL;
}

int main() {
    pthread_t threads[NUM_THREADS];
    for (int i = 0; i < NUM_THREADS; i++) {
        pthread_create(&threads[i], NULL, worker, NULL);
    }
    for (int i = 0; i < NUM_THREADS; i++) {
        pthread_join(threads[i], NULL);
    }
    pthread_mutex_destroy(&lock); // Clean up

    long long expected = (long long)NUM_THREADS * NUM_INCREMENTS;
    printf("Expected counter value: %lld\n", expected);
    printf("Actual counter value:   %lld\n", counter);

    return 0;
}
Now, compile and run the fixed version. The result will be correct. More importantly, run valgrind --tool=helgrind ./counter_fixed. Helgrind will now be silent, confirming that you have successfully resolved the data race.
Test your understanding!
Consider this code snippet:
int shared_data[2] = {0, 0};

void* thread_A_func(void* arg) {
    shared_data[0] = 100;
    return NULL;
}

void* thread_B_func(void* arg) {
    shared_data[1] = 200;
    return NULL;
}
If thread_A_func and thread_B_func run concurrently without any locks, would Helgrind report a data race? Why or why not?
Show answer
No, Helgrind would not report a data race.
Although both threads are writing to the same array (shared_data), they are writing to different memory locations within that array (shared_data[0] and shared_data[1]). A data race occurs when multiple threads access the same memory location without synchronization. Since they are accessing distinct locations, there is no conflict.
Helgrind vs. ThreadSanitizer (TSan)
Helgrind is powerful, but it's not the only tool available. A major alternative is ThreadSanitizer (TSan), which is built into modern compilers like GCC and Clang. Since you have a professional background, knowing the trade-offs is important.
Watch this short clip where both tools are used on the same program.
How to debug Linux multi threaded code - Greg Law - Meeting C++ 2024
In the talk 'How to debug Linux multi threaded code', Greg Law provides a succinct comparison between Helgrind and TSan.
Watch from 13:43 to 15:30. Pay attention to how each tool is invoked and the difference in execution speed. The speaker runs a racy program first with TSan, and then with Helgrind.
Here's a summary of the key differences:
| Feature | Valgrind Helgrind | ThreadSanitizer (TSan) |
|---|---|---|
| Invocation | Runs on a standard binary: valgrind --tool=helgrind ... |
Requires recompilation with a flag: gcc -fsanitize=thread ... |
| Performance | Very slow (often 50x-100x slowdown). | Much faster (typically 2x-20x slowdown). |
| Flexibility | Can run on any existing binary, even from third parties, as long as debug info is available. | Requires access to the source code to recompile. |
| Compatibility | Is a separate tool. | Can be incompatible with other sanitizers (like AddressSanitizer). |
When to choose which?
- Use TSan during development when you are frequently recompiling anyway. Its speed makes it ideal for inclusion in your regular test suite.
- Use Helgrind when you can't recompile the code (e.g., debugging a third-party library) or when you need the broader capabilities of the Valgrind suite.
Conclusion
You now have a powerful, automated tool in your debugging arsenal. Manually finding data races can feel like searching for a needle in a haystack, especially when they don't cause crashes. Helgrind changes the game by pointing you directly to the problem code.
Key Takeaways:
- A data race occurs when multiple threads access the same memory location without synchronization, with at least one access being a write.
- Helgrind is a Valgrind tool that dynamically analyzes your program to detect data races and other synchronization bugs.
- The basic workflow is to compile with
-gand run your program viavalgrind --tool=helgrind ./program. - Helgrind's reports provide the conflicting line numbers and thread call stacks, giving you all the information needed to fix the bug.
- Tools like ThreadSanitizer (TSan) offer a faster alternative but require recompilation.
Preview of the Next Lesson:
Helgrind can detect some forms of deadlock by tracking lock ordering (--track-lockorders=yes is on by default). However, Valgrind has another tool, DRD (Data Race Detector), which uses a different approach and is sometimes better at finding deadlocks and other threading errors. In the next lesson, we will explore DRD and compare its findings to what Helgrind offers.