Hello! Welcome back to your course on C threads.
In the last lesson, we explored how Valgrind's Helgrind tool can automatically detect data races, saving us from hours of manual debugging. We saw that Helgrind is excellent at finding unsynchronized memory access and also at detecting potential deadlocks by analyzing lock acquisition order.
Today, we'll continue our tour of Valgrind's concurrency tools by focusing on its sibling, DRD (Data Race Detector). The learning outcome is to use Valgrind's DRD tool to detect deadlocks and other threading errors. While DRD's name suggests its primary purpose is race detection, it uses a different underlying algorithm than Helgrind, which gives it a unique perspective and makes it particularly good at uncovering a different class of bugs, such as improper use of the Pthreads API and performance issues like lock contention.
Introducing DRD: A Different Approach
Like Helgrind, DRD is a dynamic analysis tool for finding threading errors. You invoke it similarly:
valgrind --tool=drd ./your_program
However, its internal mechanism is different. While Helgrind primarily uses a lockset-based algorithm (Eraser), DRD is based on a "happens-before" algorithm. For your CS background, this means DRD directly tracks the causal relationships between synchronization operations and memory accesses across threads. This allows it to detect data races but also provides a foundation for identifying other subtle violations of the threading model.
To get a sense of DRD's capabilities, please review its official documentation.
The official Valgrind manual for DRD provides the definitive overview of the tool.
Read the introduction (Section 8.1) and the overview of multithreaded programming problems (Section 8.1.3). This will give you a list of the kinds of problems DRD is designed to find, including data races, lock contention, and improper use of the POSIX threads API.
As you can see, DRD aims to detect a range of issues. The GitHub repository FederAndInk/lock_free_debug_tools_comparison also provides a concise summary, noting that DRD can detect data races, improper POSIX threads use, false sharing, deadlock, and monitor lock contention. We will put some of these claims to the test.
Investigating a Deadlock
Let's start by creating a classic deadlock scenario. A deadlock occurs when two or more threads are blocked forever, each waiting for a resource held by another. The most common cause is acquiring multiple mutexes in inconsistent order.
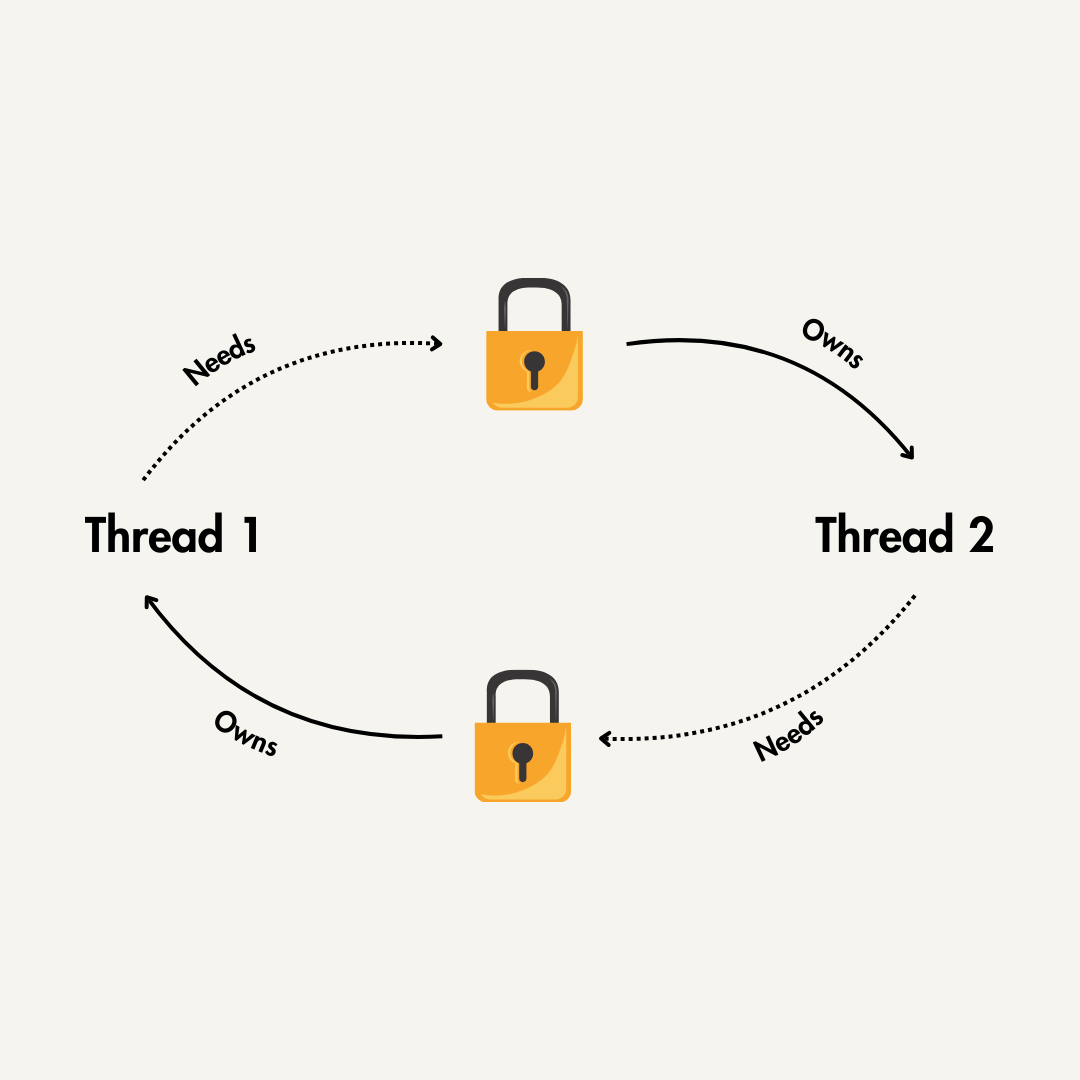
Here is a C program that implements this exact scenario:
// deadlock.c
#include <pthread.h>
#include <stdio.h>
#include <unistd.h>

pthread_mutex_t mutex1 = PTHREAD_MUTEX_INITIALIZER;
pthread_mutex_t mutex2 = PTHREAD_MUTEX_INITIALIZER;

void* thread1_func(void* arg) {
    printf("Thread 1: Locking mutex1...\n");
    pthread_mutex_lock(&mutex1);
    printf("Thread 1: Locked mutex1. Sleeping...\n");
    sleep(1); // Sleep to encourage the other thread to run

    printf("Thread 1: Trying to lock mutex2...\n");
    pthread_mutex_lock(&mutex2); // This will block forever
    printf("Thread 1: Locked mutex2.\n");

    pthread_mutex_unlock(&mutex2);
    pthread_mutex_unlock(&mutex1);
    return NULL;
}

void* thread2_func(void* arg) {
    printf("Thread 2: Locking mutex2...\n");
    pthread_mutex_lock(&mutex2);
    printf("Thread 2: Locked mutex2. Sleeping...\n");
    sleep(1);

    printf("Thread 2: Trying to lock mutex1...\n");
    pthread_mutex_lock(&mutex1); // This will block forever
    printf("Thread 2: Locked mutex1.\n");

    pthread_mutex_unlock(&mutex1);
    pthread_mutex_unlock(&mutex2);
    return NULL;
}

int main() {
    pthread_t t1, t2;

    pthread_create(&t1, NULL, thread1_func, NULL);
    pthread_create(&t2, NULL, thread2_func, NULL);

    pthread_join(t1, NULL);
    pthread_join(t2, NULL);

    printf("Finished.\n");
    return 0;
}
- Compile the program:
gcc -g -o deadlock deadlock.c -pthread - Run it:
./deadlock. The program will print a few lines and then hang indefinitely. You'll need to stop it withCtrl+C.
Now, let's run it under DRD: valgrind --tool=drd ./deadlock. You will observe that Valgrind also hangs, producing no report. This is an important lesson: DRD does not inherently detect and report on all deadlocks. In the previous lesson, we learned that Helgrind is the tool designed for this, as it tracks lock-order hierarchies and would report a "lock order violated" warning for this exact code.
So, what are the "other threading errors" that DRD excels at finding? Let's explore two of its key strengths.
Strength 1: Detecting Pthreads API Misuse
DRD is excellent at enforcing the rules of the Pthreads API. Certain actions, like unlocking a mutex from a different thread than the one that locked it, are undefined behavior but may not cause an immediate crash. DRD flags these dangerous practices.
Consider this buggy code:
// wrong_unlock.c
#include <pthread.h>
#include <stdio.h>

pthread_mutex_t lock = PTHREAD_MUTEX_INITIALIZER;

void* unlocker_thread(void* arg) {
    printf("Unlocker: Trying to unlock.\n");
    // ERROR: Unlocking a mutex locked by another thread.
    pthread_mutex_unlock(&lock);
    printf("Unlocker: Unlock successful(?).\n");
    return NULL;
}

int main() {
    pthread_t unlocker;

    printf("Main: Locking mutex.\n");
    pthread_mutex_lock(&lock);

    pthread_create(&unlocker, NULL, unlocker_thread, NULL);
    pthread_join(unlocker, NULL);

    // Main thread never unlocks it, the other thread did.
    printf("Main: Finished.\n");
    return 0;
}
If you compile and run this (gcc -g -o wrong_unlock wrong_unlock.c -pthread), it might appear to work, but it's relying on undefined behavior. Now, let's see what DRD thinks:
valgrind --tool=drd ./wrong_unlock
DRD will immediately produce an error report similar to this:
==12345== Thread 2:
==12345== Attempt to unlock a mutex that was locked by another thread
==12345==    at 0x484A22F: pthread_mutex_unlock (drd_pthread_intercepts.c:837)
==12345==    by 0x1091E5: unlocker_thread (wrong_unlock.c:9)
==12345==    by 0x4849E24: my_thread_wrapper (drd_pthread_intercepts.c:389)
==12345==    by 0x4971AC2: start_thread (pthread_create.c:442)
==12345== Lock was locked at
==12345==    at 0x4849D9F: pthread_mutex_lock (drd_pthread_intercepts.c:753)
==12345==    by 0x109230: main (wrong_unlock.c:17)
This report is unambiguous. It tells you a mutex was unlocked by a thread that didn't own it and provides stack traces for both the illegal unlock and the original lock acquisition. This is one of many API misuses DRD can find that you saw listed in the manual.
Strength 2: Detecting Lock Contention
Another powerful feature of DRD is its ability to detect lock contention—situations where threads are excessively delayed waiting for a lock. This is not a correctness bug like a data race, but it can be a major performance bottleneck.
DRD finds this using the --exclusive-threshold=<n> option, where n is a time in milliseconds. If a thread holds a mutex or a writer lock for longer than this threshold, DRD issues a warning.
Let's write a program to demonstrate this:
// contention.c
#include <pthread.h>
#include <stdio.h>
#include <unistd.h>

pthread_mutex_t lock = PTHREAD_MUTEX_INITIALIZER;

void* long_holder(void* arg) {
    printf("Holder: Locking and holding for 200ms...\n");
    pthread_mutex_lock(&lock);
    usleep(200 * 1000); // Hold the lock for 200 milliseconds
    pthread_mutex_unlock(&lock);
    printf("Holder: Unlocked.\n");
    return NULL;
}

void* waiter(void* arg) {
    sleep(1); // Let the other thread grab the lock first
    printf("Waiter: Waiting for lock...\n");
    pthread_mutex_lock(&lock);
    printf("Waiter: Got the lock.\n");
    pthread_mutex_unlock(&lock);
    return NULL;
}

int main() {
    pthread_t t1, t2;
    pthread_create(&t1, NULL, long_holder, NULL);
    pthread_create(&t2, NULL, waiter, NULL);
    pthread_join(t1, NULL);
    pthread_join(t2, NULL);
    return 0;
}
Compile and run this program with DRD, setting a threshold of 100ms:
valgrind --tool=drd --exclusive-threshold=100 ./contention
DRD will detect that the lock was held for longer than the threshold and produce a detailed report.
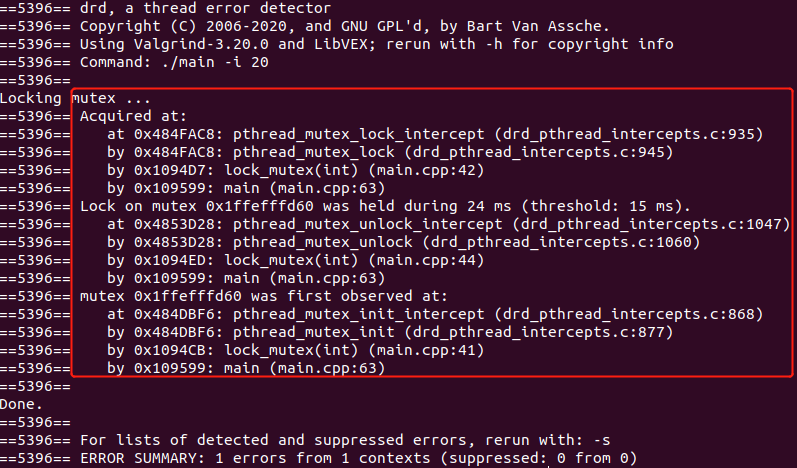
This feature is invaluable for performance tuning, as it helps you find critical sections that are too broad or contain slow operations (like I/O) that should be moved outside the locked region.
Test your understanding!
You are debugging a program that sometimes becomes very slow but doesn't crash or hang forever. You suspect the issue is related to a mutex being held for too long during a file I/O operation inside a critical section. Which Valgrind tool and command-line flag would be most effective for confirming this suspicion?
Show answer
The most effective tool would be DRD with the --exclusive-threshold=<milliseconds> flag. For example: valgrind --tool=drd --exclusive-threshold=50 ./my_program. This would generate a report if any mutex is held for more than 50 milliseconds, pointing directly to the critical section causing the slowdown. Helgrind would not detect this, as it is a performance issue, not a lock-ordering or data-race bug.
DRD in the Valgrind Ecosystem
It's crucial to know when to use Memcheck, Helgrind, and DRD. The DRD manual has a section on "DRD Versus Memcheck" that offers good advice. Here's a practical workflow:
- Run Memcheck first:
valgrind --tool=memcheck ./program. Ensure your program is free of memory errors like leaks, invalid reads/writes, and use of uninitialized values. Concurrency bugs can sometimes be masked by or confused with memory errors. - Run Helgrind next:
valgrind --tool=helgrind ./program. Use it to find data races and, importantly, potential deadlocks caused by lock-order inversion. Fix these correctness issues. - Finally, run DRD:
valgrind --tool=drd ./program. Use DRD to catch other classes of bugs, such as Pthreads API misuse, and to analyze performance by checking for lock contention with--exclusive-threshold.
Conclusion
Today we've seen that while DRD's name focuses on data races, its true value often lies in its ability to detect other subtle but critical threading errors. It serves as an excellent complement to Helgrind.
Key Takeaways:
- DRD is a Valgrind tool (
--tool=drd) that uses a "happens-before" algorithm to detect threading errors. - While Helgrind is generally the preferred tool for detecting potential deadlocks via lock-order analysis, DRD excels at identifying other issues.
- DRD is highly effective at detecting Pthreads API misuses, such as unlocking a mutex from the wrong thread.
- DRD can identify performance bottlenecks caused by lock contention using the
--exclusive-thresholdflag. - A robust debugging strategy involves using Memcheck, Helgrind, and DRD together to cover memory errors, correctness, and performance.
Preview of the Next Lesson:
We have one more stop on our Valgrind tour. Both Helgrind and DRD require proper memory management to function correctly. In the next lesson, we will focus on using Valgrind's memcheck tool to detect memory leaks specific to thread resources, such as failing to join a thread or destroy a mutex. This will complete your understanding of how the Valgrind suite helps you write robust multithreaded C applications.