Hello! Welcome back to our course.
In our last few lessons, we've explored different ways to draw conclusions from data. We started with the t-test, a classic tool for comparing group means, which operates under a set of strict assumptions. Then we shifted gears to Bayesian thinking, where we learned to update our beliefs as new evidence comes in.
Today, we're returning to hypothesis testing to tackle a very practical and common question in data science: What happens when our data doesn't follow the rules? Specifically, what do you do when your data isn't normally distributed, violating a key assumption of tests like the t-test?
This lesson will teach you how to identify when to use parametric vs. non-parametric statistical tests. We'll define what these terms mean, explore the trade-offs between them, and establish a clear framework for making the right choice for your analysis.
1. The Fundamental Choice: Assumptions vs. Flexibility
At the heart of many statistical tests are assumptions about the data's underlying distribution. This is the main dividing line between our two types of tests.
- Parametric Tests: These tests assume that your data was drawn from a specific probability distribution, which can be described by a set of parameters. The most common assumption is that the data follows a normal distribution, characterized by its mean () and standard deviation (). The t-test you learned about is a prime example.
- Non-Parametric Tests: These tests are "distribution-free." They don't make assumptions about the underlying distribution of the data. This makes them more flexible and robust.
So, why not always use non-parametric tests? The main trade-off is statistical power. If the assumptions of a parametric test are met, it is more powerful—meaning it's more likely to detect a statistically significant effect if one truly exists.
To get a clear overview of the factors that guide this choice, let's watch a short video.
How to choose an appropriate statistical test
The video 'How to choose an appropriate statistical test' by TileStats provides an excellent introduction to this decision-making process. It highlights the key questions you need to ask about your data.
Please watch the segment from 02:33 to 05:04. Focus on the reasons given for choosing a parametric test versus a non-parametric one, especially concerning the data's distribution, sample size, and the presence of extreme values (outliers).
As the video explained, the decision hinges on a few key checks:
- Normality: Is the data approximately normally distributed?
- Sample Size: A larger sample size (often n > 30) can sometimes make parametric tests robust even with skewed data, thanks to the Central Limit Theorem.
- Outliers: Parametric tests are sensitive to extreme values, whereas non-parametric tests are more robust.
- Data Type: Non-parametric tests are often the only choice for ordinal data (like rankings or satisfaction ratings).
2. The "Magic" of Non-Parametric Tests: Using Ranks
You might be wondering how a test can work without making assumptions about the data's distribution. The most common technique is to transform the data by ranking it. Instead of using the raw values, the test uses their position in a sorted list. This simple transformation makes the test robust to outliers and the underlying distribution.
Let's watch another short video that illustrates this concept beautifully.
What is the difference between parametric and nonparametric hypothesis testing?
This video, 'What is the difference between parametric and nonparametric hypothesis testing?' from numiqo, clearly demonstrates how ranking works in practice.
Watch the section from 01:54 to 05:43. Pay close attention to the two examples provided: How Spearman correlation (non-parametric) uses the ranks of age and reaction time, unlike Pearson correlation (parametric). How the Mann-Whitney U test (non-parametric) calculates rank sums for two groups, instead of comparing means like a t-test.
By converting values to ranks, the exact magnitude of outliers becomes less important. For example, in a dataset [1, 2, 3, 100], the value 100 would have a huge influence on the mean. But its rank is simply 4. This ranking mechanism is the key to the robustness of non-parametric tests.
3. A Practical Decision-Making Framework
Now let's put this all together into a step-by-step process. When you're faced with a dataset and need to choose a test, you can follow this logic.
Step 1: Understand Your Goal and Data
- Question: Are you comparing independent groups, paired groups, or looking for a relationship (correlation)?
- Data Type: Is your data continuous (interval/ratio), ordinal, or nominal?
Step 2: Check the Assumptions for a Parametric Test
The article "Parametric vs. Non-Parametric Tests and When to Use Them" provides a great summary of these assumptions and the decision criteria.
Parametric vs. Non-Parametric Tests and When to Use Them
This article from 'Built In' gives clear, actionable guidelines. We'll focus on the sections that list the assumptions and the criteria for choosing.
Please read the sections 'What Is a Parametric Test?' and 'When to Use Parametric vs. Non-Parametric Tests'. This will give you a concise checklist of conditions.
The most critical assumption to check is normality. You can assess this both visually and with a statistical test.
- Visual Check: A histogram or a Q-Q (Quantile-Quantile) plot. A Q-Q plot plots the quantiles of your data against the quantiles of a theoretical normal distribution. If the data is normal, the points will fall along a straight 45-degree line.
- Statistical Check: The Shapiro-Wilk test is a common choice. Its null hypothesis is that the data is normally distributed. Therefore, if you get a small p-value (e.g., < 0.05), you reject the null hypothesis and conclude your data is likely not normal.
Here is a quick Python example showing how to generate a Q-Q plot, which is a very useful skill for your data science toolkit.
import numpy as np
import statsmodels.api as sm
import matplotlib.pyplot as plt


# Generate some data that is NOT normal (e.g., skewed)
np.random.seed(42)
non_normal_data = np.random.exponential(size=100)


# Generate some data that IS normal
normal_data = np.random.normal(loc=0, scale=1, size=100)


# Create Q-Q plots
fig, (ax1, ax2) = plt.subplots(1, 2, figsize=(12, 5))

sm.qqplot(non_normal_data, line='45', ax=ax1)
ax1.set_title('Q-Q Plot for Non-Normal Data (Exponential)')

sm.qqplot(normal_data, line='45', ax=ax2)
ax2.set_title('Q-Q Plot for Normal Data')

plt.show()
Notice how the points for the normal data stick closely to the red line, while the points for the non-normal data deviate significantly.
Step 3: Choose Your Test
Based on the checks above, you can now make an informed choice. The flowchart below is a great visual summary of the entire decision process.
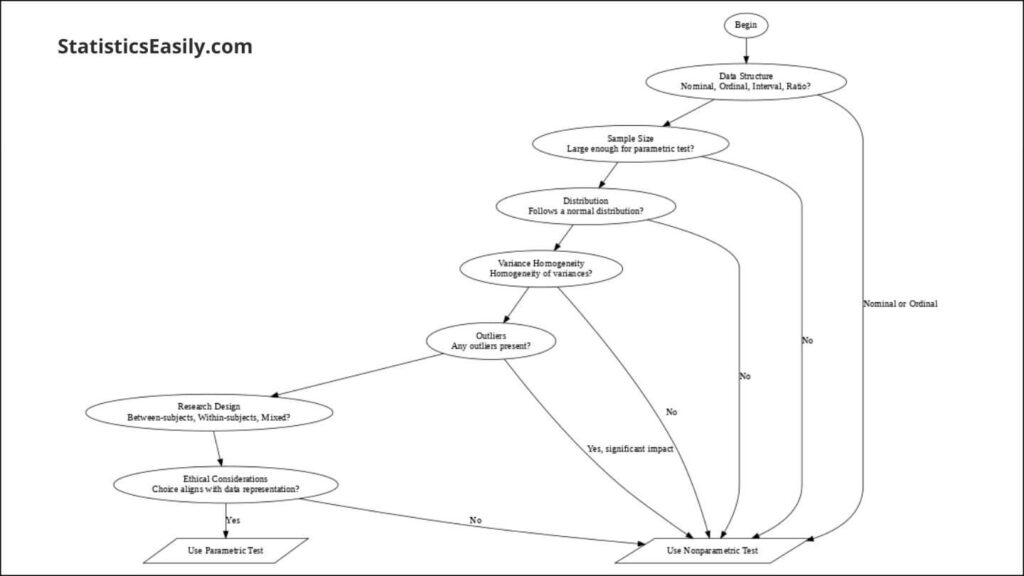
4. Common Parametric/Non-Parametric Pairs
To make this more concrete, here is a table of common statistical tasks and their corresponding parametric and non-parametric tests. You've already encountered the t-test and will soon learn about correlation.
| Goal | Parametric Test (if assumptions met) | Non-Parametric Alternative |
|---|---|---|
| Compare means of 2 independent groups | Independent Samples t-test | Mann-Whitney U Test |
| Compare means of 2 paired groups | Paired Samples t-test | Wilcoxon Signed-Rank Test |
| Compare means of >2 independent groups | ANOVA | Kruskal-Wallis Test |
| Measure relationship between 2 variables | Pearson Correlation | Spearman Correlation |
If you need to implement these non-parametric tests in Python, the scipy.stats library has you covered. The article "How to Calculate Nonparametric Statistical Hypothesis Tests in Python" by Jason Brownlee is an excellent hands-on guide for this, which you can save for future reference. For example, running a Mann-Whitney U test is just one line of code:
from scipy.stats import mannwhitneyu


# data1, data2 are your two independent samples
stat, p_value = mannwhitneyu(data1, data2)
Conclusion
Great work today! You now have a solid framework for one of the most common decisions in statistical analysis: choosing the right tool for the job. This prevents you from applying tests incorrectly and drawing invalid conclusions.
Key Takeaways:
- Parametric tests are powerful but rely on strict assumptions about your data's distribution (e.g., normality).
- Non-parametric tests are more flexible and robust because they don't assume a specific distribution, often by using ranks instead of raw data.
- The choice involves a trade-off: power vs. flexibility. Always prefer a parametric test if your data meets its assumptions.
- You can check for normality using visual tools like Q-Q plots and statistical tests like the Shapiro-Wilk test.
Preview of the next lesson:
In this lesson, we briefly mentioned the Pearson and Spearman tests for measuring relationships. In our next session, we will dive deep into this topic. We'll learn how to calculate and interpret correlation coefficients, and more importantly, discuss the critical distinction between correlation and causation—a concept that is absolutely fundamental to thinking like a data scientist.