Hello! Welcome to your next lesson on Exploratory Data Analysis.
In our last session, we learned how to create and interpret histograms, box plots, and scatter plots. You saw how box plots can visually flag data points that lie far from the rest, which we called "potential outliers." This visual intuition is a great starting point.
Today, we will formalize that intuition. The goal of this lesson is to learn how to identify potential outliers using statistical methods like the IQR rule and z-scores. We'll move from just seeing outliers to programmatically detecting them. Understanding how to handle these unusual data points is a critical step in building robust machine learning models, as they can significantly skew results.
1. What Are Outliers and Why Do They Matter?
Before we dive into detection methods, let's establish a clear understanding of what outliers are and the impact they can have on our analysis.
How to Detect Outliers in Python: A Comprehensive Guide
The article 'How to Detect Outliers in Python' provides a great introduction. It defines outliers, explains their common causes, and discusses their impact on statistical measures.
Please read the first two sections of the article: 'What Are Outliers?' and 'Impact of Outliers on Data'. Pay close attention to how outliers affect the mean and standard deviation, as this is a key reason we need to identify them.
As the article explained, outliers are not just errors. They can be genuine, rare events. However, whether they are errors or real, they can distort statistical summaries. A single extreme value can pull the mean in its direction and inflate the standard deviation, giving you a misleading picture of your data's center and spread. This is why we need systematic ways to flag them for further investigation.
2. Method 1: The Interquartile Range (IQR) Rule
This first method is a direct statistical formalization of the box plot you learned about in the last lesson. It's a robust method because it relies on the median and percentiles, which are less sensitive to extreme values than the mean and standard deviation.
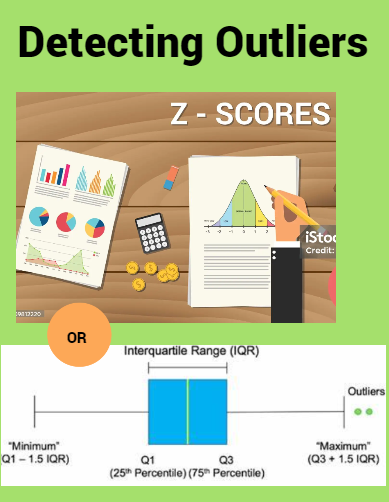
The core idea is to define a "reasonable" range of data and flag anything that falls outside of it. The IQR rule defines this range using the quartiles:
- Q1 (First Quartile): The 25th percentile. 25% of the data is below this value.
- Q3 (Third Quartile): The 75th percentile. 75% of the data is below this value.
- IQR (Interquartile Range): The distance between Q3 and Q1 (
IQR = Q3 - Q1). This represents the spread of the middle 50% of your data.
The rule then sets up "fences":
- Lower Fence:
- Upper Fence:
Any data point that is less than the lower fence or greater than the upper fence is considered a potential outlier.
Let's watch a video that walks through this concept and its implementation in Python.
Outlier detection and removal using IQR | Feature engineering tutorial python # 4
The 'codebasics' channel provides a very clear, step-by-step explanation of the IQR method using a practical example.
Watch from 00:37 to 06:56. The video will cover: A clear explanation of percentiles (Q1 and Q3). How to calculate the IQR and the upper/lower limits. A hands-on Python demo using pandas to find and remove outliers.
Hands-on Practice with IQR
Now, let's apply this yourself. We'll use a pandas DataFrame with some sample height data, similar to the video.
import pandas as pd
import numpy as np


# Sample data with some clear outliers
data = {'height_cm': [165, 172, 175, 168, 171, 180, 169, 55, 240, 173, 166]}
df = pd.DataFrame(data)


# 1. Calculate Q1, Q3, and IQR
Q1 = df['height_cm'].quantile(0.25)
Q3 = df['height_cm'].quantile(0.75)
IQR = Q3 - Q1

print(f"Q1: {Q1}")
print(f"Q3: {Q3}")
print(f"IQR: {IQR}\n")


# 2. Define the outlier fences
lower_fence = Q1 - 1.5 * IQR
upper_fence = Q3 + 1.5 * IQR

print(f"Lower Fence: {lower_fence}")
print(f"Upper Fence: {upper_fence}\n")


# 3. Identify the outliers
outliers = df[(df['height_cm'] < lower_fence) | (df['height_cm'] > upper_fence)]

print("Outliers identified by IQR method:")
print(outliers)
When you run this code, you'll see that it correctly identifies the values 55 and 240 as outliers, just as you would expect from common sense.
3. Method 2: The Z-Score Method
The Z-score method takes a different approach. It assumes your data is approximately normally distributed (i.e., it follows a bell curve). The Z-score tells you how many standard deviations away from the mean a particular data point is.
The formula is:
Where:
- is the data point.
- is the mean of the data.
- is the standard deviation of the data.
A common rule of thumb is that if a data point has a Z-score greater than 3 or less than -3, it is considered an outlier. This is because, in a normal distribution, over 99.7% of the data lies within 3 standard deviations of the mean.
Let's watch a video that explains this concept.
Statistics-Finding Outliers in Dataset using Z- score and IQR
Krish Naik's video on outlier detection covers the Z-score method clearly, explaining the formula and the reasoning behind the threshold.
Please watch from 02:43 to 05:37 to understand the Z-score concept, and then from 09:58 to 12:46 for the practical Python implementation.
Hands-on Practice with Z-Scores
Let's apply the Z-score method to the same height data. Notice that since our sample size is small and contains extreme outliers, the mean and standard deviation will be heavily skewed. This highlights a key limitation of the Z-score method.
# Using the same DataFrame as before
mean_height = df['height_cm'].mean()
std_height = df['height_cm'].std()

print(f"Mean: {mean_height:.2f}")
print(f"Standard Deviation: {std_height:.2f}\n")


# Define a threshold
threshold = 3


# Create a list to store outliers
outlier_list = []
for height in df['height_cm']:
    z_score = (height - mean_height) / std_height
    if abs(z_score) > threshold:


        # This condition is typically what you'd use.
        # However, with very strong outliers, the std dev can get so inflated
        # that the z-score of the outlier itself is reduced.
        # Let's print all z-scores to see this effect.
        pass
    print(f"Height: {height}, Z-score: {z_score:.2f}")


# A more direct pandas way to find outliers
df['z_score'] = (df['height_cm'] - mean_height) / std_height
z_score_outliers = df[abs(df['z_score']) > threshold]

print("\nOutliers identified by Z-score method (threshold=3):")
print(z_score_outliers)


# Let's try with a lower threshold
z_score_outliers_2 = df[abs(df['z_score']) > 1.5]
print("\nOutliers identified by Z-score method (threshold=1.5):")
print(z_score_outliers_2)
Running this code demonstrates an important point. The outliers 55 and 240 are so extreme that they inflate the standard deviation to 55.3. This makes the Z-scores for these outliers (-1.84 and 1.33) seem less extreme than they are, and they wouldn't be caught with a threshold of 3! This phenomenon is called masking, where one outlier "masks" another.
This is why the Z-score method is best used on larger datasets that are closer to a normal distribution, and why the IQR method is often preferred for its robustness.
4. Choosing the Right Method
So, when should you use each method?
-
Use the IQR Rule when:
- Your data is skewed (not bell-shaped).
- You want a method that is robust and not overly influenced by the extreme values you're trying to find.
- You want a method that directly corresponds to a common visualization (the box plot).
- This is generally a safe and reliable first choice.
-
Use the Z-Score Method when:
- You have good reason to believe your data is normally distributed.
- Your dataset is large enough that a few outliers won't significantly skew the mean and standard deviation.
- You are working in a statistical context where standard deviations are a natural unit of measurement.
For most initial EDA tasks, the IQR method is a more dependable starting point.
Conclusion
In this lesson, you have moved from visually spotting outliers to applying two common statistical techniques to identify them programmatically.
Key Takeaways:
- Outliers are data points that differ significantly from other observations and can skew statistical measures like the mean and standard deviation.
- The IQR rule identifies outliers as any point falling below or above . It is robust to skewed data and the presence of outliers themselves.
- The Z-score method identifies outliers as points with a Z-score above or below a certain threshold, typically . It assumes the data is normally distributed and can be sensitive to the very outliers it is trying to detect.
It's important to remember that these methods flag potential outliers, they don't automatically prove a data point is "bad". The next step is always to investigate why the outlier exists—is it a data entry error, a measurement failure, or a genuinely rare and important event? We will cover strategies for handling these flagged outliers in a later module on data preprocessing.
Preview of the next lesson:
We've now looked at datasets one variable at a time (summary statistics, histograms, outlier detection). In the next lesson, we will broaden our view to analyze relationships between multiple variables at once using pair plots and correlation heatmaps. This will allow us to quickly discover interesting patterns across our entire dataset.