Hello! Welcome to the first lesson in our new module on Supervised Learning: Classification.
In the previous module, we did a deep dive into regression, where our goal was to predict a continuous numerical value, like a house price. We ended by learning how to compare different regression models to select the best one for a given task.
Now, we shift our focus to a different but equally important type of problem: classification. Here, the goal is to predict a discrete category or class. For example, will an email be classified as "spam" or "not spam"? Will a customer "churn" or "stay"?
Today, we'll start this journey with the foundational algorithm for binary classification: Logistic Regression. By the end of this lesson, you will be able to train your own logistic regression classifier and, most importantly, interpret its output probabilities to understand why it makes certain predictions.
1. What is Classification?
Classification is about assigning items to predefined categories. While it might seem completely different from regression, there's a strong conceptual link. Let's explore why we need a new tool for these problems and can't just use the linear regression models you've already mastered.
The following video provides an excellent introduction to classification and explains the limitations of using linear regression for this type of task.
Machine Learning Tutorial Python - 8: Logistic Regression (Binary Classification)
This video, from the codebasics channel, clearly illustrates the difference between regression and classification and demonstrates why a simple linear regression line isn't a good fit for a binary (yes/no) outcome.
Watch from the beginning until 05:43. Pay close attention to the insurance example and the discussion of why drawing a straight line through binary (0 or 1) data points can lead to poor predictions, especially when new data is added.
As you saw, a straight line doesn't work well because it can predict values outside the sensible 0-to-1 range and is easily thrown off by outliers. We need a model that is specifically designed to output a value that can be interpreted as a probability—a number between 0 and 1.
2. The Core Idea: The Sigmoid Function
Logistic regression solves this problem elegantly. It starts with the same linear equation you know from linear regression:
However, instead of using the output directly, it passes this value through a special function called the sigmoid (or logistic) function. This function "squashes" any real number into a value between 0 and 1.
To build a strong intuition for this process, watch the following short video.
Logistic Regression (and why it's different from Linear Regression)
The channel 'Visually Explained' provides a crisp and clear animation of how the sigmoid function transforms a linear output into a probability.
Watch from 02:41 to 03:22. This segment focuses specifically on the role of the sigmoid function. Notice how it takes the linear result and smoothly maps it to an S-shaped curve bounded by 0 and 1.
The sigmoid function is defined by the following formula:
Where:
- is the predicted probability of the outcome being 1.
- is Euler's number (approximately 2.718).
- is the output of our linear equation.
This mathematical transformation ensures that our model's output is always a valid probability. If the linear equation produces a large positive number, becomes very small, and gets close to 1. If is a large negative number, becomes very large, and gets close to 0.
3. Training a Logistic Regression Classifier in Python
Now for the practical part. Since you're already familiar with the scikit-learn API from our regression module, you'll find the process for training a logistic regression model very familiar. The steps are nearly identical: import the model, split the data, and use the .fit() method.
The codebasics video you watched earlier continues with a great hands-on coding example.
Machine Learning Tutorial Python - 8: Logistic Regression (Binary Classification)
Let's continue with the 'codebasics' video to see how to implement logistic regression in Python using scikit-learn.
Watch the segment from 08:06 to 13:52. The presenter will guide you through: Loading the data with pandas. Splitting the data into training and testing sets using train_test_split. Importing LogisticRegression from sklearn.linear_model. Creating a model instance and training it with model.fit(X_train, y_train). Making initial predictions on the test set.
As you can see, with just a few lines of code, you have a trained classification model ready to make predictions.
4. Interpreting the Output: From Probabilities to Predictions
This is the most critical part of our lesson. How do we get from a trained model to an interpretable result? Logistic regression models in scikit-learn have two key methods for this: .predict() and .predict_proba().
model.predict(X_test): This gives you the final classification—0 or 1. By default, it classifies an instance as '1' if the calculated probability is > 0.5, and '0' otherwise.model.predict_proba(X_test): This is often more useful. It doesn't just give you the final decision; it gives you the underlying probability for each class.
Let's see how this works in practice.
Machine Learning Tutorial Python - 8: Logistic Regression (Binary Classification)
The next segment of the 'codebasics' video focuses specifically on using .predict_proba() to see the model's confidence in its predictions.
Watch the short clip from 14:35 to 15:44. Notice that the output of .predict_proba() is an array with two columns. The first column is the probability of the sample belonging to class 0, and the second is the probability of it belonging to class 1. The sum of each row is always 1.
The output of predict_proba might look like this for three test samples:
[[0.94, 0.06],
 [0.77, 0.23],
 [0.39, 0.61]]
Here's how to interpret it:
- Sample 1: The model is 94% sure it belongs to class 0 and 6% sure it belongs to class 1. The final prediction from
.predict()would be 0. - Sample 2: The model is 77% sure it's class 0. The final prediction would be 0.
- Sample 3: The model is only 39% sure it's class 0, but 61% sure it's class 1. The final prediction would be 1.
This probabilistic output is far more insightful than a simple 0 or 1. It tells you how confident the model is in its decision, which is crucial for many real-world applications.
For a more detailed written guide on implementation and interpretation that you can refer back to, the following article is an excellent resource.
The 'Real Python' guide on Logistic Regression provides a thorough, step-by-step written tutorial that complements what you've seen in the videos.
Please read 'Step 4: Evaluate the Model'. Focus on the parts explaining .predict_proba() and .predict(). Compare the probability matrix shown in the article with the final array of predictions to solidify your understanding of how the 0.5 threshold is used.
5. Your First Classification Challenge
You've absorbed the theory and seen a demonstration. Now it's time to apply your knowledge, which is the best way to make it stick. The codebasics video ends with a practical exercise. This is a perfect opportunity for you to write your first classification script from scratch.
Machine Learning Tutorial Python - 8: Logistic Regression (Binary Classification)
At the end of his tutorial, the presenter introduces an exercise using a real-world HR analytics dataset to predict employee retention.
Watch from 15:44 to the end. Listen to the problem description and the tasks involved. Then, open your Jupyter notebook and try to solve it yourself! The goal is to build a logistic regression model to predict whether an employee will leave the company. Don't worry about getting it perfect; the main goal is to practice the workflow: loading data, selecting features, splitting, fitting, and predicting.
This exercise is a fantastic way to transition from theoretical knowledge to practical skill, which is a core goal of your learning journey. Take your time with it, and remember that the solution notebook is available in the video's description if you get stuck or want to compare your approach.
Conclusion
Congratulations on completing your first lesson in classification! You've taken a significant step from predicting numbers to predicting categories.
Key Takeaways:
- Classification is for predicting discrete categories, and linear regression is not suitable for this task.
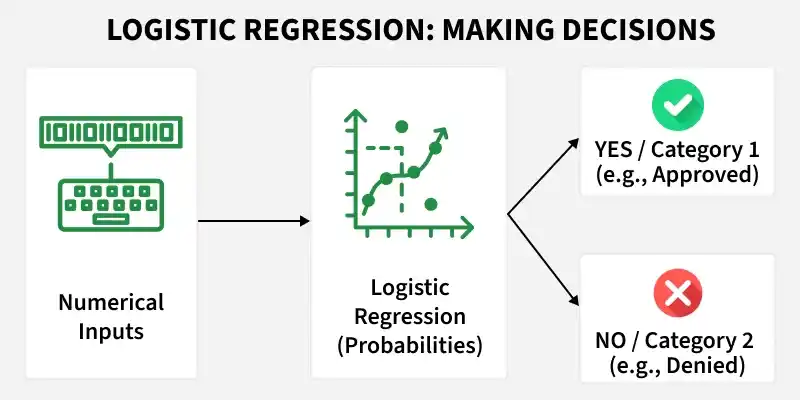
- Logistic Regression uses a linear model combined with the sigmoid function to produce an output between 0 and 1, which can be interpreted as a probability.
- In scikit-learn, you train a model using
.fit(X, y). - You can get the final class predictions with
.predict()or, more informatively, the class probabilities with.predict_proba(). The probabilities tell you the model's confidence in each prediction.
Preview of the next lesson:
Now that you can train a classifier, the next logical question is: "How good is it?" In the next lesson, we will explore the essential metrics used to evaluate a classification model, including accuracy, precision, recall, F1-score, and the confusion matrix. This will allow you to measure your model's performance and understand its strengths and weaknesses.