Hello! Welcome back to our module on Supervised Learning.
In the previous lesson, we built our first classification model using Logistic Regression. You learned how to train the model and, crucially, how to interpret its output probabilities using .predict_proba() to understand the model's confidence in its predictions.
Now that we have a model that makes predictions, the natural next question is: "How good is this model?" Just as we used metrics like MSE and R-squared for regression, we need a specific toolkit for classification. This lesson will equip you with the fundamental tools and metrics to evaluate any classification model. By the end of our 60 minutes, you will be able to evaluate a classifier using accuracy, precision, recall, F1-score, and the all-important confusion matrix.
1. The Confusion Matrix: Your Evaluation Hub
Before we dive into any specific metrics, we must first understand the confusion matrix. It's a simple table that provides a complete picture of how a model's predictions align with the actual, true labels. All other classification metrics are derived from this matrix, making it the most important concept in this lesson.
A confusion matrix breaks down predictions into four categories. To understand them intuitively, let's watch a short video from StatQuest. It uses a clear example of predicting heart disease.
Machine Learning Fundamentals: The Confusion Matrix
This video from 'StatQuest with Josh Starmer' offers a brilliant and easy-to-follow explanation of the confusion matrix.
Watch from 01:21 to 03:36. Pay close attention to the definitions of the four key terms: True Positives (TP): The model correctly predicts the positive class. True Negatives (TN): The model correctly predicts the negative class. False Positives (FP): The model incorrectly predicts the positive class (a "false alarm"). False Negatives (FN): The model incorrectly predicts the negative class (a "miss").
To solidify this, let's look at another common example: spam detection. Here, "Spam" is our positive class (1) and "Not Spam" is our negative class (0).

Based on this image:
- True Positives (TP) = 5: 5 emails were actually spam, and the model correctly identified them.
- True Negatives (TN) = 7: 7 emails were not spam, and the model correctly identified them.
- False Positives (FP) = 1: 1 email was not spam, but the model incorrectly flagged it as spam.
- False Negatives (FN) = 1: 1 email was spam, but the model failed to catch it.
With these four values, we can now calculate a range of performance metrics.
2. The Core Metrics: Accuracy, Precision, and Recall
While the confusion matrix gives us the raw numbers, we need standardized metrics to quantify and compare model performance. Let's explore the most common ones.
The following video provides a great visual walkthrough of how accuracy, precision, and recall are calculated from the confusion matrix values.
Precision, Recall, F1 score, True Positive|Deep Learning Tutorial 19 (Tensorflow2.0, Keras & Python)
The 'codebasics' channel has a tutorial that clearly explains how to derive metrics from the TP, FP, TN, and FN counts.
Watch from 03:37 to 06:01. The video will walk you through the definitions and formulas for: Accuracy (03:37 - 04:06) Precision (04:06 - 04:55) Recall (04:55 - 06:01)
Let's summarize these key metrics:
Accuracy
This is the most straightforward metric. It answers the question: "What proportion of all predictions did the model get right?"
When to use it: When your classes are balanced and you care equally about predicting both positive and negative classes correctly.
When to be cautious: Accuracy can be very misleading on imbalanced datasets. If a disease affects 1% of the population, a model that always predicts "no disease" will be 99% accurate but completely useless for diagnosis.
Precision
Precision focuses on the positive predictions. It answers: "Of all the predictions for the positive class, how many were correct?"
High precision means your model has a low rate of false positives.
- Example: In spam detection, high precision is vital. You don't want important emails (false positives) being sent to the spam folder. It's better to let a few spam emails through (lower recall) than to lose a critical message.
Recall (or Sensitivity)
Recall also focuses on the positive class, but from a different angle. It answers: "Of all the actual positive cases, how many did the model identify?"
High recall means your model has a low rate of false negatives.
- Example: In medical diagnosis (e.g., cancer detection), high recall is paramount. You want to identify all actual patients, even if it means some healthy people are wrongly flagged for more tests (lower precision). Missing a true positive case (a false negative) can have severe consequences.
3. The Precision-Recall Trade-off and the F1-Score
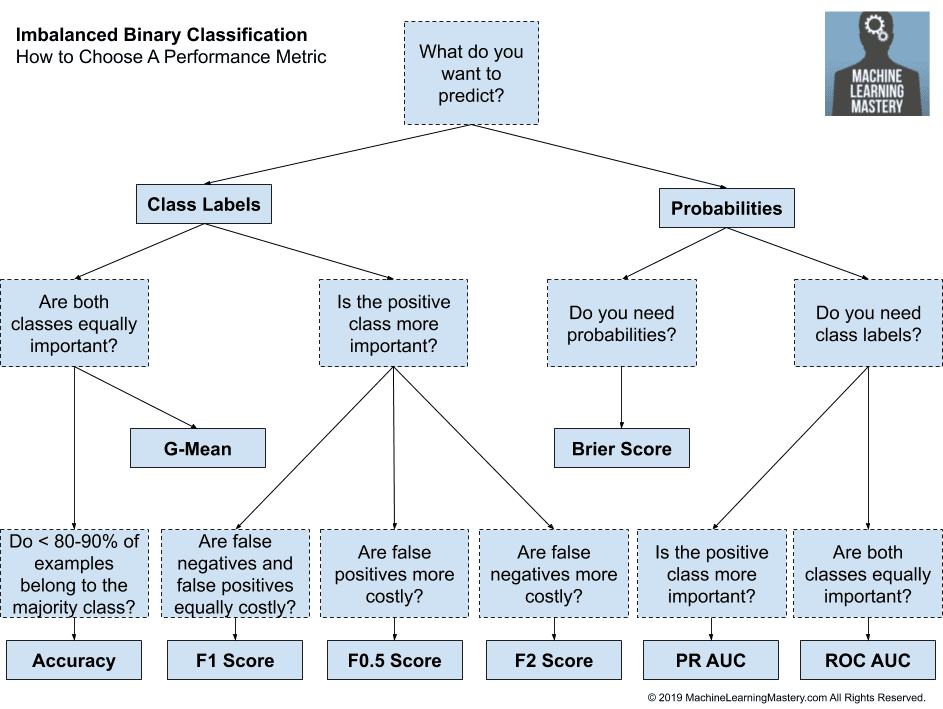
As you can see, there is often a trade-off between precision and recall. Improving one can sometimes hurt the other. Choosing which one to prioritize depends entirely on your project's goal.
The following article provides an excellent discussion of this trade-off using the real-world example of breast cancer detection.
Confusion Matrix Made Simple: Accuracy, Precision, Recall & F1-Score
This article, 'Confusion Matrix Made Simple' from Towards Data Science, expertly explains why you need more than just accuracy and how to think about the trade-offs.
Read the section that begins with 'But why do we have four different classification metrics...'. It starts just after the formulas for the metrics. Pay close attention to the discussion about the breast cancer dataset and the consequences of prioritizing recall over precision.
So what do you do when you need a balance between both? That's where the F1-Score comes in.
The F1-Score is the harmonic mean of precision and recall. It provides a single number that balances both metrics. It's particularly useful when you have imbalanced classes and care about minimizing both false positives and false negatives.
The codebasics video you saw earlier also provides a quick explanation of the F1-score.
Precision, Recall, F1 score, True Positive|Deep Learning Tutorial 19 (Tensorflow2.0, Keras & Python)
Let's revisit the 'codebasics' video for a brief definition of the F1-score.
Watch the short segment from 07:22 to 07:56 to see the formula and understand its purpose as a combined measure.
4. Practical Evaluation with Scikit-learn
Now that you understand the theory, let's turn to the practical side. Scikit-learn's metrics module makes calculating all these metrics incredibly simple. You don't need to manually compute TP, FP, etc.
The most useful function is classification_report, which generates a text summary of all the key metrics for each class.
The following guide provides a clear, code-based walkthrough of how to use scikit-learn's evaluation functions.
Calculating Classification Metrics Scikit-learn
This guide from apxml.com is a perfect reference for implementing classification metrics in Python. It provides clear code snippets for each function.
Read through this entire short page. Focus on understanding the code structure for: accuracy_score confusion_matrix precision_score, recall_score, f1_score The all-in-one classification_report This will serve as an excellent cheat sheet for your future projects.
To see this in action, the codebasics video concludes with a demonstration of generating a confusion matrix and classification report in Python.
Precision, Recall, F1 score, True Positive|Deep Learning Tutorial 19 (Tensorflow2.0, Keras & Python)
Let's watch the final segment of the 'codebasics' video to see how the theoretical metrics map directly to the output of scikit-learn's functions.
Watch from 07:56 to 10:59. Notice how the values in the printed classification_report (precision, recall, f1-score) match the ones calculated manually earlier in the video. This is the workflow you will use in your own projects.
Your Turn: As a practical exercise, I encourage you to go back to the HR analytics exercise from our previous lesson. After you've trained your logistic regression model and made predictions, use confusion_matrix and classification_report to evaluate its performance. Ask yourself: in this context (predicting employee churn), would you prioritize precision or recall?
Conclusion
Great work! You've now built the essential skills to not only build a classification model but also to critically evaluate its performance. This is a crucial step towards building reliable and effective AI systems.
Key Takeaways:
- The Confusion Matrix (TP, TN, FP, FN) is the foundation for evaluating classification models.
- Accuracy is a simple metric but can be misleading, especially with imbalanced data.
- Precision measures the quality of positive predictions (low false positives), while Recall measures the quantity of identified positive cases (low false negatives).
- The choice between prioritizing precision or recall depends on the specific business problem.
- The F1-Score offers a balanced measure when both precision and recall are important.
- Scikit-learn's
classification_reportprovides a convenient and comprehensive summary of these metrics.
Preview of the next lesson:
Now that you know how to build and evaluate a classifier, we will expand your modeling toolkit. In the next lesson, we will explore a completely different type of classification algorithm: K-Nearest Neighbors (KNN). It's an intuitive, instance-based model, and you'll be able to use the metrics you learned today to compare its performance against the logistic regression model.