Hello! Welcome back to our journey through supervised learning for classification.
In our last lessons, you've built models using two different philosophies: one based on linear boundaries (Logistic Regression) and another on distance (K-Nearest Neighbors). You've learned how to train them, make predictions, and evaluate their performance.
Today, we're exploring a third, very different, and highly intuitive approach: Decision Trees. These models mimic human decision-making by learning a series of "if/else" questions. This makes them incredibly transparent and easy to understand. By the end of this lesson, you will be able to train a decision tree classifier and, most importantly, visualize the resulting tree to understand its internal logic.
1. The Logic of a Decision Tree: A "White Box" Model
Unlike models that can feel like a "black box" (where the decision-making process is hard to inspect), decision trees are often called "white box" models. They provide a clear, visual flowchart of the logic they used to arrive at a prediction.
The core idea is to recursively split the data into smaller, more homogeneous groups based on the features. At each step, the algorithm asks a question about a feature to create the "purest" possible split. But what does "pure" mean?
This is determined by a metric that measures the level of impurity or disorder in a group of data points. The goal is to find splits that decrease this impurity as much as possible. Two common metrics are:
- Gini Impurity: Measures the probability of misclassifying a randomly chosen element from the set. A Gini score of 0 means the set is perfectly pure (all elements belong to one class). A score of 0.5 (in a binary classification problem) means the set is maximally impure (a 50/50 split of classes).
- Entropy: Originating from information theory, entropy also measures the amount of disorder. An entropy of 0 indicates a perfectly pure set.
Scikit-learn's DecisionTreeClassifier uses the Gini index by default. To understand these concepts more formally, please read the following section from a DataCamp tutorial.
Decision Tree Classification in Python Tutorial
This article introduces the core concepts behind how a decision tree works, focusing on the Attribute Selection Measures (ASM) that guide its splits.
Read the section titled 'Attribute Selection Measures'. Focus on understanding the high-level idea behind Gini Index and Information Gain (which uses Entropy). You don't need to memorize the formulas, but grasp that these are the metrics the tree uses to decide on the best feature and value to split the data at each node.
In essence, at every node, the tree searches through every feature and every possible split point for that feature. It calculates the Gini impurity for each potential split and chooses the one that results in the lowest weighted average impurity for the resulting child nodes.
2. Training a Decision Tree with Scikit-learn
Now that you have the conceptual foundation, let's move to the practical implementation. Given your experience with scikit-learn's API, you'll find this process familiar.
The steps are standard: import the classifier, create an instance, and use the .fit() method.
# 1. Import necessary libraries
from sklearn.datasets import load_breast_cancer
from sklearn.model_selection import train_test_split
from sklearn.tree import DecisionTreeClassifier
from sklearn.metrics import accuracy_score


# 2. Load and split the data
data = load_breast_cancer()
X = data.data
y = data.target
feature_names = data.feature_names
class_names = data.target_names

X_train, X_test, y_train, y_test = train_test_split(X, y, test_size=0.3, random_state=42)


# 3. Initialize and train the classifier
# We'll start with default parameters
clf = DecisionTreeClassifier(random_state=42)
clf.fit(X_train, y_train)


# 4. Make predictions and evaluate
y_pred = clf.predict(X_test)
accuracy = accuracy_score(y_test, y_pred)
print(f"Accuracy: {accuracy:.4f}")
Running this code will train a decision tree and report its accuracy. However, this doesn't yet help us understand the logic it learned. For that, we need visualization.
3. Visualizing and Interpreting the Tree
This is where the power of decision trees truly shines. We can plot the entire tree structure to see exactly how it makes decisions. Scikit-learn provides a function called plot_tree for this purpose.
The video below provides an excellent walkthrough of how to generate this plot and, more importantly, how to interpret what each part of it means.
Visualizing Decision Trees in Python
This video from NeuralNine will show you not only how to plot the tree but also how to read and understand each node.
Watch from 05:05 to 09:06. Pay close attention to the explanation of the different elements within each node: the splitting condition, Gini impurity, number of samples, class distribution (value), and the final predicted class.
Let's break down a node using an example visualization to solidify your understanding.
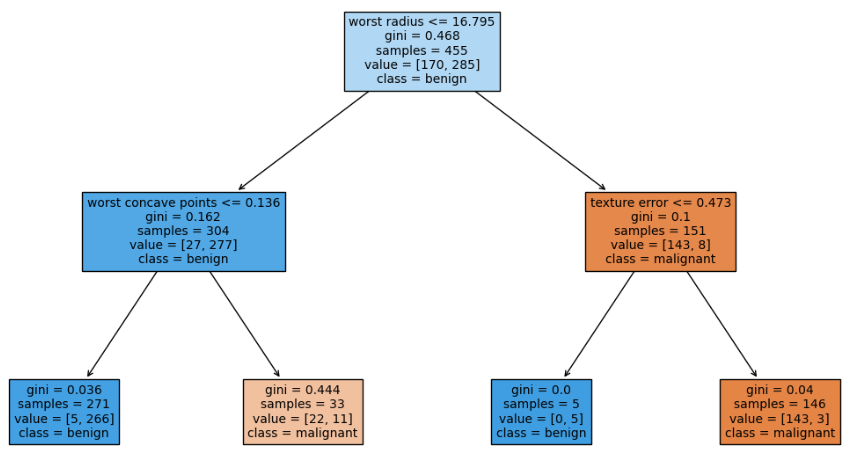
Let's analyze the root node (the very top one):
worst radius <= 16.795: This is the decision rule. For any data point, if its 'worst radius' feature is less than or equal to 16.795, it goes down the left branch (True). Otherwise, it goes down the right branch (False).gini = 0.463: This is the Gini impurity of the node. Since this is the root node containing all 398 training samples, it's not pure.samples = 398: This tells us how many training samples are in this node.value = [149, 249]: This shows the distribution of classes among the samples in this node. Here, there are 149 samples of the first class ('malignant') and 249 of the second class ('benign').class = benign: This is the prediction the model would make if it stopped at this node. It's simply the majority class in thevaluearray.
By following the path from the root node down to a leaf node (a node with no children), you can trace the exact sequence of rules that leads to a final classification. This transparency is a key advantage of decision trees.
4. Controlling Complexity to Avoid Overfitting
If you were to plot the tree we trained in the code snippet from section 2, you would see a very large, complex tree. By default, a decision tree will keep splitting the data until every leaf node is perfectly pure (or contains only one sample). While this results in 100% accuracy on the training data, it almost always leads to overfitting. The model learns the noise and quirks of the training set too well and fails to generalize to new, unseen data.
To combat this, we can control the tree's complexity, a process called pruning. The simplest way is pre-pruning, where we stop the tree from growing too deep by setting constraints.
One of the most important parameters for this is max_depth. Let's see how setting this hyperparameter can give us a more manageable and often better-performing model.
Decision Tree Classification in Python Tutorial
This section of the DataCamp tutorial demonstrates how to optimize a decision tree by setting max_depth and then visualizes the simpler, pruned tree.
Read the section 'Optimizing Decision Tree Performance'. Notice how creating a new classifier with max_depth=3 not only improves the accuracy on the test set but also results in a much more interpretable tree. This is a practical example of the bias-variance tradeoff in action.
By limiting the depth, we force the model to only learn the most important patterns in the data, making it more robust. Other useful pre-pruning parameters include:
min_samples_split: The minimum number of samples a node must have before it can be split.min_samples_leaf: The minimum number of samples a leaf node must have.
Conclusion
Great job today! You have now learned how to train, visualize, and interpret a decision tree classifier. This is a significant step in building your practical machine learning skills, as interpretability is highly valued in many real-world applications.
Key Takeaways:
- Decision trees are "white box" models that classify data using a series of if-then-else rules.
- The logic for splitting is based on minimizing impurity, typically measured by the Gini Index or Entropy.
- You can train a
DecisionTreeClassifierin scikit-learn using the familiar.fit()method. - The
sklearn.tree.plot_treefunction is essential for visualizing the tree's logic, allowing you to inspect every decision rule. - Uncontrolled trees are prone to overfitting. You can control their complexity using pre-pruning techniques, such as setting the
max_depthhyperparameter.
Preview of the next lesson:
All the datasets we've used so far have had a relatively balanced number of samples for each class. But what happens when one class is much rarer than another (e.g., fraud detection, where fraudulent transactions are a tiny fraction of the total)? In our next lesson, we will tackle this problem by learning about handling class imbalance, starting with a technique called stratified splitting.