Hello! Welcome to the next lesson in your data science journey.
In our last session, we focused on cleaning our data by handling outliers. With a cleaner dataset, we're now ready for one of the most creative and impactful stages in a machine learning project: feature engineering. This is where data scientists often add the most value, as creating good features can be more important than choosing a complex model.
Today's learning outcome is to engineer new features from existing ones, including polynomial, interaction, and temporal features. We'll move from simply preparing data to actively creating new, more powerful predictors that can help our models uncover deeper patterns.
1. What are Polynomial and Interaction Features?
Often, the relationship between a feature and the target variable isn't a simple straight line. For instance, the price of a house might not just increase linearly with its area; it might increase at an accelerating rate. Feature engineering allows us to capture these complex, non-linear relationships.
We'll start by exploring two techniques for this: creating polynomial features (like ) and interaction features (like ).
To understand why we need these and how to create them, let's watch a video that starts with the limitations of a simple linear model and then introduces the solution.
Polynomial Regression in Python
This video by NeuralNine provides an excellent demonstration of why linear models can fail on non-linear data and how creating polynomial features solves this problem.
Watch from the beginning until 12:30. The first part (until 10:37) shows a linear model struggling to fit a curved pattern. The second part (from 10:37 to 12:30) introduces PolynomialFeatures from scikit-learn as the way to fix this.
As the video explained, the core idea is to transform our features. We create new columns in our dataset that are powers of the original features. Then, we can fit a LinearRegression model on this expanded set of features. The model is still linear with respect to its coefficients, but the result is a curve that can fit our data much better.
Here is a simple visual of what's happening. An original feature 'Area' is used to create a new feature 'Area^2'.

The Danger of Overfitting
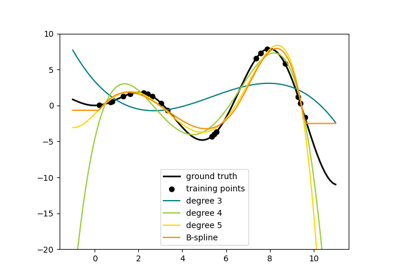
With PolynomialFeatures, you can choose the degree of the polynomial. A higher degree creates a more complex curve. While this might seem like a good thing, it comes with a significant risk: overfitting. An overly complex model might fit the noise in your training data perfectly but fail to generalize to new, unseen data. This is a key aspect of the bias-variance tradeoff you are interested in.
The next part of the video you just watched provides a great visual explanation of this risk.
Polynomial Regression in Python
Let's continue with the same video to see what happens when we choose a polynomial degree that is too high.
Watch from 12:30 to 14:39. Focus on the explanation of why a very complex function that hits every data point perfectly is actually a bad model.
This image further illustrates the concept. The goal is to find a curve that captures the underlying trend (the "ground truth") without being overly influenced by the random noise in the training points.
Interaction Features
Sometimes, the predictive power comes from the combination of two features. For example, the effectiveness of an advertising budget might depend on the season. In this case, creating a feature like ad_spend * is_holiday_season could be very powerful.
PolynomialFeatures can also create these interaction terms. The following short video explains the concept and how to create only interaction terms.
Create feature interactions using PolynomialFeatures
This video from Data School clearly explains the 'why' and 'how' of interaction features.
Watch from 00:16 to 02:28 to understand the rationale and see the code. Then, watch the important note from 03:07 to 03:52, which explains when this technique is most useful.
As you saw, you can generate only interaction terms by setting interaction_only=True. This is especially useful for linear models, as tree-based models like Decision Trees and Random Forests can learn interactions implicitly by how they split the data.
2. Best Practices for Implementation
Now that we have the concepts, let's look at a complete, practical implementation in Python. The best way to use PolynomialFeatures is within a scikit-learn Pipeline, which ensures your transformations are applied consistently. This also gives us a great preview of our next lesson!
This article provides a superb walkthrough and also highlights some crucial best practices.
Polynomial Regression: Complete Guide with Math, Implementation ...
This guide from mbrenndoerfer.com shows a complete scikit-learn implementation and summarizes key best practices.
First, read the section 'Implementation in Scikit-learn'. Focus on how PolynomialFeatures and LinearRegression are combined in a Pipeline. Then, read the section 'Best Practices' to learn about the importance of feature scaling and using cross-validation to choose the degree.
Let's summarize the key takeaways from that reading:
- Use Pipelines: Always combine your
PolynomialFeaturestransformer with your model in aPipeline. This prevents mistakes and makes your code cleaner. - Scale Your Features First: As discussed in a previous lesson, it's critical to scale your features (e.g., using
StandardScaler) before applyingPolynomialFeatures. High-degree polynomials can create extremely large numbers, leading to numerical instability. The pipeline should look like:StandardScaler->PolynomialFeatures->LinearRegression. - Use Cross-Validation: Don't guess the best polynomial degree. Use cross-validation to test different degrees and find the one that performs best on unseen data, not just the training data.
3. Engineering Temporal Features
Many datasets contain date and time information. In their raw format (e.g., 2023-10-27 10:30:00), these columns are not very useful for most machine learning models. We need to extract meaningful numerical features from them. This is another form of feature engineering.
Common temporal features include:
- Time elapsed between two events.
- Day of the week, month, or year.
- Time of day (e.g., morning, afternoon).
- Whether a date is a holiday.
The following resource gives practical Python examples for creating these features using pandas.
A Practical Guide to Feature Engineering in Python - Fritz ai
This article from Fritz AI demonstrates how to extract valuable information from date/time columns.
Read the section titled 'Working with date features'. Pay attention to the use of pd.to_datetime and the .dt accessor in pandas to extract different components from a date column.
Here is a consolidated code example based on what you just read. If you have a DataFrame df with a column event_date, you can create new features like this:
import pandas as pd


# First, ensure the column is in datetime format
df['event_date'] = pd.to_datetime(df['event_date'])


# Extract date components using the .dt accessor
df['year'] = df['event_date'].dt.year
df['month'] = df['event_date'].dt.month
df['day_of_week'] = df['event_date'].dt.dayofweek # Monday=0, Sunday=6
df['hour'] = df['event_date'].dt.hour


# Calculate time elapsed since a specific point
# For example, days since the first event in the dataset
time_elapsed = (df['event_date'] - df['event_date'].min()).dt.days
df['days_since_start'] = time_elapsed

print(df.head())
This process transforms a single, unhelpful column into multiple, potentially very predictive numerical features.
Conclusion
Today, you've moved beyond data cleaning into the art of feature creation. This is a pivotal skill that separates good data scientists from great ones.
Key Takeaways:
- Feature Engineering is the process of creating new features from existing ones to improve model performance.
- Polynomial Features help models capture non-linear relationships. Use
sklearn.preprocessing.PolynomialFeatures, but be cautious of overfitting by choosing the degree carefully using cross-validation. - Interaction Features model the combined effects of two or more features. You can create them using
PolynomialFeatures(interaction_only=True). - Temporal Features are created by extracting components (like month, day of week) or calculating durations from date/time columns, typically using the pandas
.dtaccessor.
Preview of the next lesson:
In this lesson, you saw how a Pipeline can be used to chain a feature transformer (PolynomialFeatures) and a model. In our next session, we will fully explore this concept. You will learn how to build a reusable preprocessing pipeline using scikit-learn's Pipeline and ColumnTransformer, allowing you to combine all the steps we've learned—imputation, scaling, encoding, and feature engineering—into a single, clean, and robust object.