Introduction
Hello! In our last lesson, we dove into the world of Linux logging, learning how to use journalctl and traditional tools like tail and grep to understand what happened on a system. When you see an error in a log, the next logical question is often why it happened. Was the application starved of CPU? Was the database waiting on a slow disk?
This lesson provides the tools to answer those "why" questions. We will move from analyzing event logs to interpreting performance metrics. This is a critical step in troubleshooting, allowing you to correlate system events with resource contention.
Today, we'll focus on the learning outcome: Monitor system resource usage (CPU, memory, I/O) with vmstat, iostat, and sar. These three commands form the bedrock of classic Linux performance analysis. You will learn:
- How to get a quick, system-wide overview with
vmstat. - How to perform a deep dive into disk performance with
iostat. - How to use
sarto analyze both real-time and historical performance data.
By the end of this lesson, you'll be able to quickly diagnose whether a performance problem is rooted in CPU, memory, or I/O bottlenecks.
1. A Systematic Approach: The USE Method
Before we jump into the commands, let's establish a mental model for troubleshooting. When faced with a "slow" system, it's easy to get lost in the sea of available metrics. A structured approach is essential. One of the most effective is the USE Method, developed by performance expert Brendan Gregg.
The USE Method is simple: for every resource, check Utilization, Saturation, and Errors.
- Utilization: The percentage of time a resource is busy. A resource at 100% utilization is a bottleneck.
- Saturation: The degree to which the resource has extra work it can't service, often indicated by a queue. High saturation leads to performance degradation.
- Errors: The count of error events. These are usually easy to spot and indicate clear problems.
The tools we're covering today are perfect for applying this method to your system's core hardware resources.
To get a formal introduction to this powerful methodology, please read this short section from Brendan Gregg's 'Linux Performance Tools' presentation.
Read the section titled 'The USE Method'. You'll find it a few pages into the PDF under the 'Methodologies' heading. Focus on understanding the definition of Utilization, Saturation, and Errors.
2. The Quick Overview: vmstat
vmstat (virtual memory statistics) is your first go-to command for a high-level snapshot of the system. Despite its name, it provides crucial information on processes, memory, block I/O, and CPU activity, all in one compact view. It's ideal for quickly determining where to focus your investigation.
This video demonstrates vmstat in a real-world troubleshooting scenario.
Linux Performance Troubleshooting Demos
In this 'Linux Performance Troubleshooting Demos' video, watch how vmstat is used as an initial diagnostic tool to analyze a report of increased application latency.
Watch the segment from 00:52 to 02:40. Pay close attention to how the presenter interprets the r (runnable processes), swap, and wa (wait I/O) columns to form a hypothesis about the bottleneck.
The output of vmstat is dense, so let's break down the most important columns.
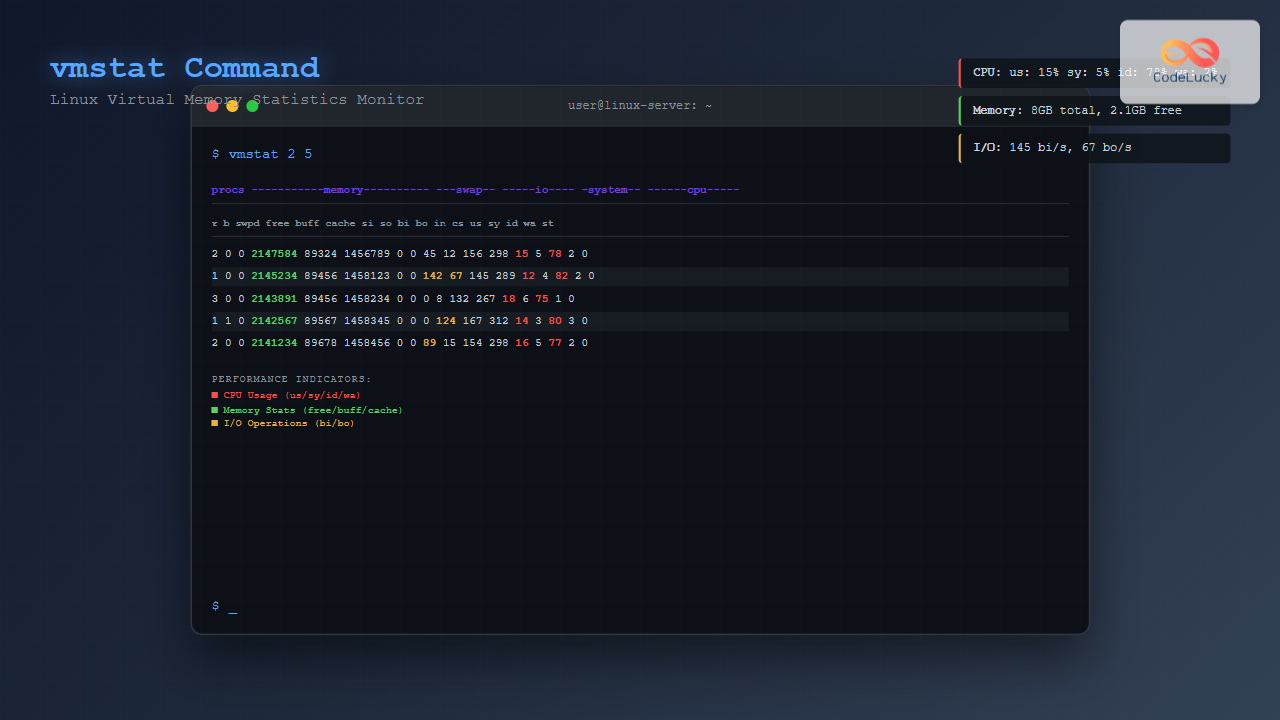
Here is a guide to interpreting the key fields, as detailed in the blog post "Linux Performance Monitoring and Optimization".
Key vmstat Metrics:
| Category | Column | What it Means | Red Flag |
|---|---|---|---|
| Processes | r |
Runnable processes. The number of processes waiting for CPU time. | A value consistently greater than your number of CPU cores indicates CPU saturation. |
b |
Blocked processes. Processes in uninterruptible sleep, usually waiting for I/O. | A consistently high number suggests an I/O problem. | |
| Swap | si / so |
Swap-in / Swap-out. Memory being moved from/to the disk. | Any non-zero value is a strong indicator of memory pressure. The system is out of RAM. |
| CPU | wa |
Wait I/O. Percentage of CPU time spent idle while waiting for an I/O operation to complete. | A consistently high value (e.g., >20%) points directly to a disk I/O bottleneck. |
You can explore these metrics in more detail by reading the vmstat section of this resource.
Linux Performance Monitoring and Optimization: sar, iostat, vmstat ...
This blog post clearly breaks down the vmstat command and its output.
Read the section '1. vmstat: Virtual Memory Statistics'. Focus on the 'Understanding vmstat Output' subsection to solidify your knowledge of each column.
3. The I/O Specialist: iostat
If vmstat suggests an I/O bottleneck (e.g., high wa or b values), your next step is iostat. This tool provides detailed statistics for your block devices (disks), helping you confirm the bottleneck and understand its nature.
Let's see it in action.
Linux Performance Troubleshooting Demos
Continuing with the same troubleshooting demo, the presenter now uses iostat to confirm the I/O bottleneck suspected from the vmstat output.
Watch from 03:03 to 04:03. Notice the focus on the %util column and the rule of thumb provided for interpreting it.
The extended statistics (-x flag) are particularly useful.
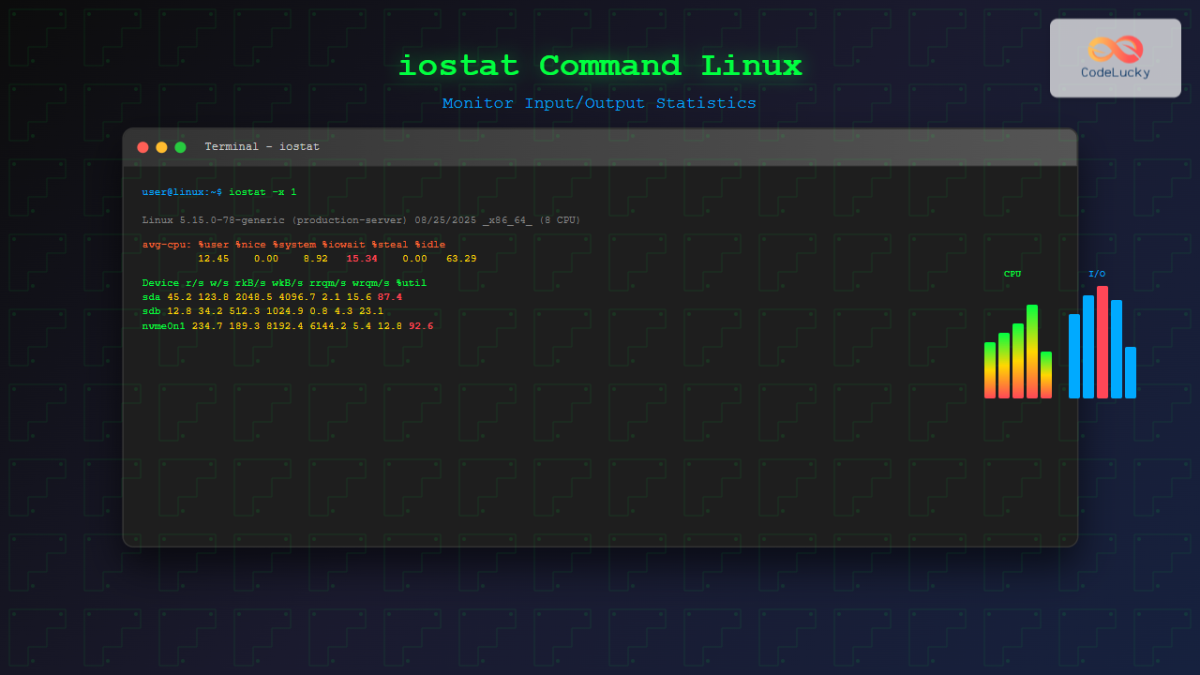
Here are the critical metrics from iostat -x to watch for.
Key iostat Metrics:
| Metric | What it Means | Red Flag |
|---|---|---|
%util |
Device Utilization. Percentage of time the device was busy processing requests. | A value consistently above 80-90% means the device is saturated. It's a bottleneck. |
await |
Average Wait Time. The average time (in milliseconds) from when a request is issued to when it is completed. | High values indicate latency. What's "high" depends on the disk type (e.g., <1ms for NVMe, <10ms for SSDs, higher for HDDs). |
avgqu-sz |
Average Queue Size. The average number of requests waiting to be serviced. | A value consistently greater than 1 suggests that requests are arriving faster than the disk can handle them, indicating saturation. |
r/s, w/s |
Reads/Writes per Second. The number of I/O operations per second (IOPS). | Useful for characterizing the workload (is it read-heavy or write-heavy?). |
This next reading provides more detail on these metrics and helpful performance thresholds.
Linux Performance Monitoring and Optimization: sar, iostat, vmstat ...
This section of the performance monitoring article focuses exclusively on iostat.
Please read the section '2. iostat: I/O Statistics'. Pay special attention to the 'Performance Thresholds' which give you practical guidelines for when to be concerned.
4. The Historical Analyst: sar
While vmstat and iostat are excellent for real-time analysis, what if a problem occurred last night? The System Activity Reporter (sar) is the tool for the job. sar is part of the sysstat package, which also collects and archives performance data in /var/log/sysstat/. This allows you to investigate past performance issues with the same level of detail as real-time monitoring.
sar can report on nearly every subsystem. You can think of it as a tool that can provide the same data as vmstat and iostat, but with the added superpower of a time machine.
Let's look at another video that demonstrates a few sar use cases.
Linux Performance: Is it CPU, Memory, or I/O? | Into the Terminal 166
This video from Red Hat touches on several performance tools. We'll focus on a segment that introduces tools for different types of I/O, including network I/O, which sar is well-suited to analyze.
Watch the segment from 31:40 to 37:43. Although it uses tools like lsrq and iftop, the presenter is diagnosing a network I/O issue. This is a perfect use case for sar -n DEV, which provides similar network interface statistics (rxkB/s, txkB/s). The key takeaway is the concept of monitoring specific subsystems over intervals, which is sar's specialty.
Common sar Commands:
- CPU Usage:
sar -u 1 5(Report CPU usage every 1 second, 5 times). - Memory Usage:
sar -r 1 5(Report memory and swap usage). - Block I/O:
sar -b 1 5(Report I/O and transfer rate stats, similar toiostat). - Network Stats:
sar -n DEV 1 5(Report network interface statistics). - Historical Data:
sar -u -f /var/log/sysstat/sa10(Report CPU usage from the log file for the 10th day of the month).
The true power of sar lies in its versatility and historical reporting.
Linux Performance Monitoring and Optimization: sar, iostat, vmstat ...
To get a full sense of sar's capabilities, please review this section of the performance monitoring guide.
Read the section '3. sar: System Activity Reporter'. This will show you the breadth of metrics sar can collect and how to query its historical data.
Conclusion
You have now added three fundamental performance analysis tools to your Linux toolkit. By combining them with the USE methodology, you can systematically and efficiently diagnose the root cause of many performance problems.
Key Takeaways:
- The Troubleshooting Trinity:
vmstat: Start here for a quick, broad overview of system health (CPU, memory, I/O).iostat: Use this for a deep dive into disk performance, especially whenvmstatshows high I/O wait.sar: The most comprehensive tool, capable of monitoring nearly all subsystems and, most importantly, analyzing historical performance data.
- The USE Method (Utilization, Saturation, Errors) provides a structured way to approach performance analysis, guiding you on what to look for.
- Key Bottleneck Indicators:
- CPU Saturation:
vmstat'srcolumn > number of CPUs. - Memory Pressure:
vmstat'ssi/socolumns are non-zero. - I/O Bottleneck:
vmstat'swacolumn is high, oriostat's%utilis near 100% with highawaittimes.
- CPU Saturation:
Preview of the Next Lesson:
Monitoring gives you visibility, but the next step is often automation. In our next lesson, you'll learn how to schedule and manage recurring tasks using cron and systemd timers. This will enable you to automate maintenance scripts, reporting, and other routine jobs, moving from reactive monitoring to proactive system management.