Hello! Welcome back to the course.
In our last lesson, we explored SELinux and Mandatory Access Control, which gave you a powerful toolset for securing a Linux host at the process and filesystem level. Now, we're going to shift our focus from what's happening inside the machine to what's happening between machines.
Today's learning outcome is to capture and analyze network traffic at the packet level using tcpdump for troubleshooting. This is a fundamental skill that directly addresses the "grey area" you mentioned in networking. As a DevOps engineer, you're often the first line of defense when services can't communicate. Whether it's a pod in Kubernetes failing to reach a database, a CI/CD agent unable to contact a code repository, or a web server throwing connection errors, tcpdump allows you to see the raw truth of what's happening on the wire.
In this lesson, we will cover:
- The core function of
tcpdumpand its most important options. - How to build powerful filters to isolate the exact traffic you need.
- The professional workflow of capturing traffic on a remote server and analyzing it locally.
- A practical approach to diagnosing a common connectivity problem using
tcpdump.
1. What is tcpdump?
tcpdump is a command-line packet analyzer. It allows you to intercept and display TCP/IP and other packets being transmitted or received over a network. Since it runs in the terminal, it's an indispensable tool for troubleshooting on servers, in containers, or any environment where you don't have a graphical user interface.
While tools like Wireshark provide a rich graphical interface for packet analysis, the standard professional workflow often involves using tcpdump on a remote server to capture the traffic and then transferring the capture file to your local machine for in-depth analysis with Wireshark.
Let's begin with a foundational video that introduces the tool and its basic operation.
The video 'Introduction to TCPDUMP' provides an excellent, clear starting point. It covers the basics of starting a capture, interpreting the output, and using the most essential command-line options.
Watch the first three minutes of the video: Introduction and Basic Commands (00:00 - 02:57): Pay close attention to the purpose of tcpdump, why it needs sudo, and the use of the -D (list interfaces), -i (specify interface), -c (count), and -n (no name resolution) options.
As you saw, one of the first things to do is identify which network interface you want to listen on.
# List available interfaces
sudo tcpdump -D


# A basic capture on the 'eth0' interface (press Ctrl+C to stop)
sudo tcpdump -i eth0
The output can be a bit overwhelming and scroll by quickly. This is where options become critical. The How to Handle Network Troubleshooting with tcpdump article provides a great reference table of these options.
How to Handle Network Troubleshooting with tcpdump
This article from OneUptime will serve as a useful reference throughout the lesson. For now, just familiarize yourself with the 'Essential Options' table.
Review the sections 'Understanding tcpdump Basics' and 'Getting Started'. Focus on the table under 'Essential Options'. You'll see the flags covered in the video (-i, -n, -c) plus a few others we'll use shortly, like -w and -r.
2. Interpreting Packet Information
When you run tcpdump, each line of output represents a single packet. Understanding its structure is key to analysis.
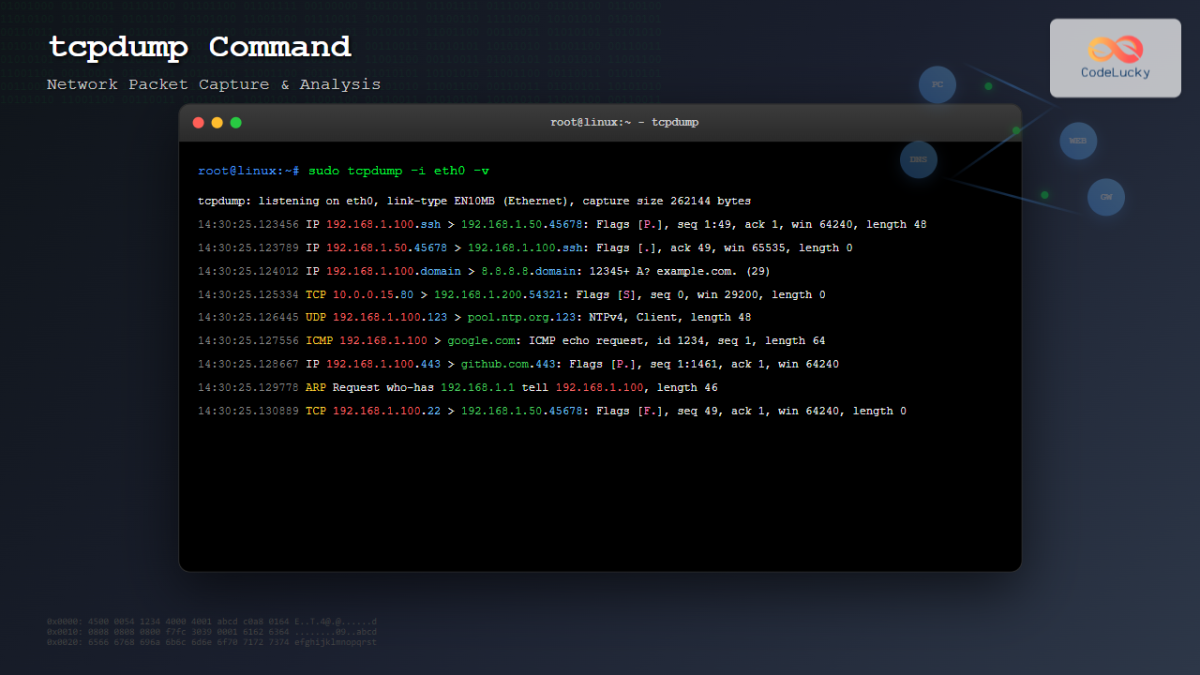
A standard line of TCP packet output looks something like this:
10:15:32.123456 IP 192.168.1.100.45678 > 93.184.216.34.80: Flags [S], seq 12345, win 65535, options [mss 1460], length 0
Let's break that down:
10:15:32.123456: TimestampIP: Protocol (Layer 3)192.168.1.100.45678: Source IP address and source port93.184.216.34.80: Destination IP address and destination portFlags [S]: TCP Flags.[S]is SYN,[.]is ACK,[P]is PUSH,[F]is FIN,[R]is RST.seq 12345: The TCP sequence number of the data in this packet.win 65535: The TCP window size (how much data the sender is willing to receive).length 0: The length of the payload data in bytes.
The video you watched earlier provided a great explanation of these fields. For a deeper dive, especially on how tcpdump displays TCP handshakes, sequence numbers, and even application-layer data like DNS, the next segment is very helpful.
Let's return to the 'Introduction to TCPDUMP' video to understand the output in more detail.
Watch the following sections: TCP Dump Output (04:16 - 08:07): This part details the TCP output format, including flags, relative sequence/acknowledgement numbers, and window size. This is dense but crucial for understanding TCP behavior. Sample DNS Output (08:07 - 09:36): See how tcpdump can even provide insights into application-layer protocols like DNS.
3. The Power of Filtering
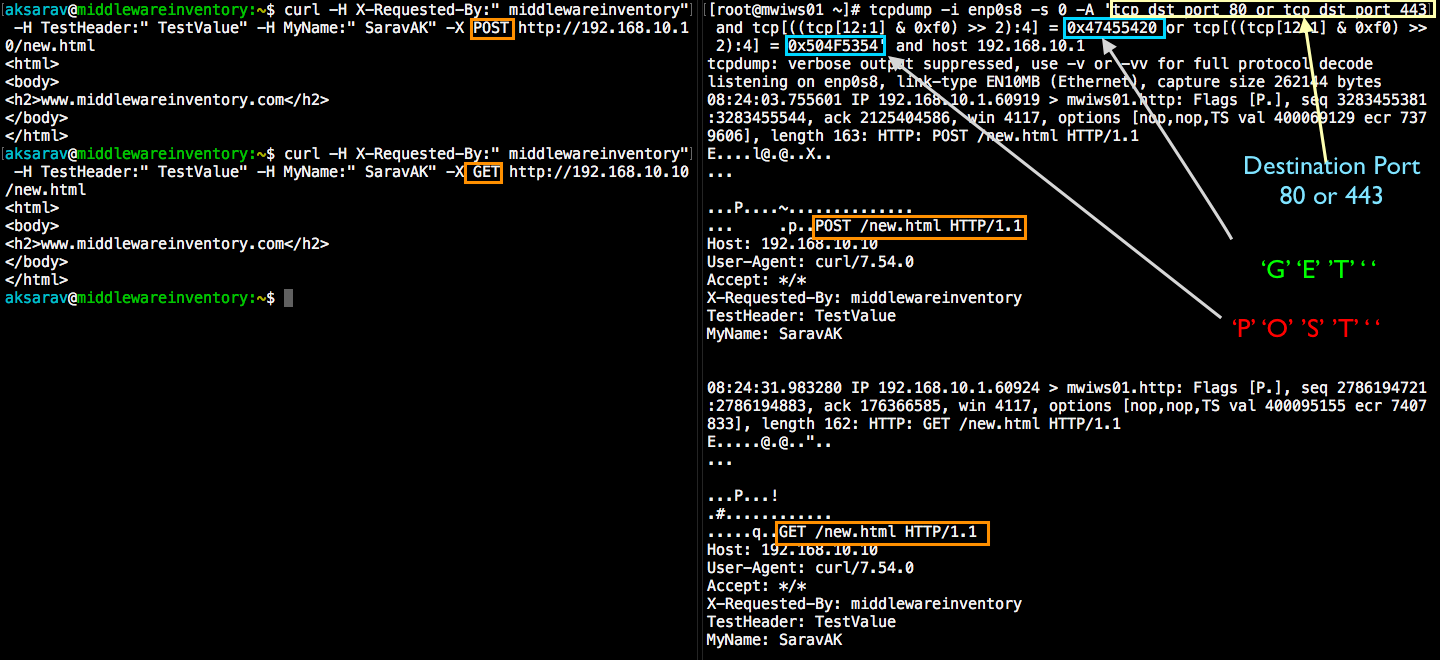
Capturing all traffic is rarely useful. The real power of tcpdump comes from its filtering capabilities, which use the Berkeley Packet Filter (BPF) syntax. This lets you zero in on exactly the traffic you're interested in.
Filters are composed of expressions and can be combined with logical operators like and, or, and not.
Here are the most common filter types:
| Filter Type | Description | Example Command |
|---|---|---|
| Host | Traffic to or from an IP/host. | sudo tcpdump -nn host 8.8.8.8 |
| Source or destination. | sudo tcpdump -nn src host 10.0.1.5 |
|
| Port | Traffic on a specific port. | sudo tcpdump -nn port 443 |
| Source or destination port. | sudo tcpdump -nn dst port 22 |
|
| Protocol | Only capture a given protocol. | sudo tcpdump -nn icmp |
| Network | Traffic involving a subnet. | sudo tcpdump -nn net 192.168.1.0/24 |
Combining Filters:
To troubleshoot a web server at 10.10.5.20, you might want to see all HTTP/HTTPS traffic to it, but exclude health checks from your load balancer at 10.10.1.1:
sudo tcpdump -i eth0 -nn 'host 10.10.5.20 and (port 80 or port 443) and not host 10.10.1.1'
Notice the single quotes around the filter expression. This is important to prevent the shell from misinterpreting special characters like parentheses.
The following video provides excellent hands-on examples of building these filters.
The video 'Introduction to TCPDUMP' has a comprehensive section covering the most important filter expressions you'll use daily.
Watch the section on Filter Expressions (10:59 - 15:56). It provides clear examples for filtering by host, source/destination, logical operators, ports, networks, protocols, and even specific TCP flags like SYN and RST.
4. The Professional Workflow: Saving and Reading Captures
Watching live traffic is useful for quick checks, but for serious analysis, you'll want to save the capture to a file. This creates a .pcap (packet capture) file that you can analyze later with tcpdump or a graphical tool like Wireshark.
-w <filename>: Write packets to a file.-r <filename>: Read packets from a file.
Scenario: You suspect an issue with a containerized application on a remote server.
-
On the server, start a capture and save it to a file. Use filters to keep the capture size manageable.
# Capture up to 5000 packets destined for port 3306 (MySQL) and save to a file sudo tcpdump -i eth0 -c 5000 -w mysql_traffic.pcap 'dst port 3306' -
Transfer the file to your local machine using
scpor another method.scp user@remote-server:~/mysql_traffic.pcap . -
On your local machine, you can now analyze it.
# Read the file with tcpdump
tcpdump -r mysql_traffic.pcap -nn


# Or, for much deeper analysis, open it with Wireshark
wireshark mysql_traffic.pcap
This workflow is demonstrated very effectively in the next video.
tcpdump - Traffic Capture & Analysis
The video 'tcpdump - Traffic Capture & Analysis' by HackerSploit does a great job of showing this exact capture-and-analyze workflow.
Watch the segment from 18:48 to 22:56. The instructor demonstrates how to use the -w flag to save a capture to a .pcap file and then opens that file in Wireshark, highlighting the power of this two-step process.
5. Practical Troubleshooting Scenario
Let's apply what we've learned.
Problem: A newly deployed microservice (orders-service) is failing. The logs show "Connection Timed Out" when trying to reach the postgres-db service at IP 10.244.1.50 on port 5432.
Your Goal: Determine where the communication is breaking down.
You ssh into the node where the orders-service pod is running.
Step 1: Formulate a filter.
You need to see traffic between your service and the database. The source IP will be the pod's IP (let's say 10.244.2.100) and the destination is the database.
# Filter for traffic between the service and the DB on the correct port
sudo tcpdump -i any -nn 'host 10.244.2.100 and host 10.244.1.50 and port 5432'
(Using -i any is often useful in complex environments like Kubernetes to capture on all interfaces, though it can be noisy.)
Step 2: Analyze the output.
-
Scenario A: You see nothing. If you restart the
orders-serviceand still see no packets matching your filter, the application might be misconfigured (e.g., wrong DB address) and isn't even attempting a connection. The problem is likely not the network itself. -
Scenario B: You see SYN packets, but no replies.
14:01:10.123 IP 10.244.2.100.54321 > 10.244.1.50.5432: Flags [S], ...
14:01:11.123 IP 10.244.2.100.54321 > 10.244.1.50.5432: Flags [S], ... (retransmit)
14:01:13.123 IP 10.244.2.100.54321 > 10.244.1.50.5432: Flags [S], ... (retransmit)
This indicates your service is trying to start a TCP connection (
SYN), but it's getting no response. This strongly suggests a firewall issue (like a Network Policy in Kubernetes or a security group in AWS) or a routing problem preventing the packets from reaching the database server. -
Scenario C: You see SYN packets, then RST packets in reply.
14:02:20.456 IP 10.244.2.100.54322 > 10.244.1.50.5432: Flags [S], ...
14:02:20.457 IP 10.244.1.50.5432 > 10.244.2.100.54322: Flags [R.], ...
The
[R]flag stands for Reset. This means the packet reached the destination server, but the server's OS actively rejected the connection on that port. This usually means no process is listening on port5432on the DB server. The database process is likely crashed or not running.
Conclusion
You've now learned how to use tcpdump to look "under the hood" of your network. This skill transforms network troubleshooting from guesswork into a data-driven forensic process.
Key Takeaways:
tcpdumpis a command-line tool for capturing network packets, essential for server and container environments.- Always start with a filter. The BPF syntax allows you to isolate traffic by
host,port,net, andprotocol. - The professional workflow is to capture with
tcpdump -won the server and analyze with Wireshark locally. - By analyzing TCP flags like
[S](SYN),[R](Reset), and the absence of replies, you can diagnose a wide range of connectivity issues.
Preview of the Next Lesson:
We've seen the packets, the protocols, and the handshakes in action. In our next lesson, we will begin the "Networking for DevOps Engineers" module by formalizing this knowledge. The learning outcome will be to explain the OSI and TCP/IP models and map common protocols (HTTP, DNS, TCP) to their layers. This will provide the theoretical framework to understand why the network behaves the way it does.