Hello and welcome back to our module on the Kubernetes Ecosystem and Operations.
In the last lesson, we focused on making a single application both efficient and resilient by mastering resource requests, limits, and the Horizontal Pod Autoscaler. We now have a well-behaved, scalable application, but we've been managing its manifest files manually. This approach doesn't scale well when you need to handle different environments like development, staging, and production, each with its own unique configuration.
This is where Helm, the package manager for Kubernetes, becomes essential. This lesson addresses the learning outcome: Create a Helm chart for an application and customize its configuration using a values.yaml file. Since you're already dabbling in Helm, this lesson will provide a structured process to formalize your knowledge and empower you to package applications professionally.
We will cover:
- The core concepts of Helm and its chart structure.
- How to create a new chart from scratch for an application.
- The process of "templatizing" your Kubernetes manifests.
- How to use
values.yamland environment-specific files to manage configuration.
1. What is a Helm Chart?
At its core, Helm helps you manage the complexity of Kubernetes applications. Instead of dealing with a collection of individual YAML files, Helm bundles them into a cohesive unit called a chart. Think of it like a package manager you're already familiar with, such as apt for Debian/Ubuntu or npm for Node.js, but designed specifically for Kubernetes.
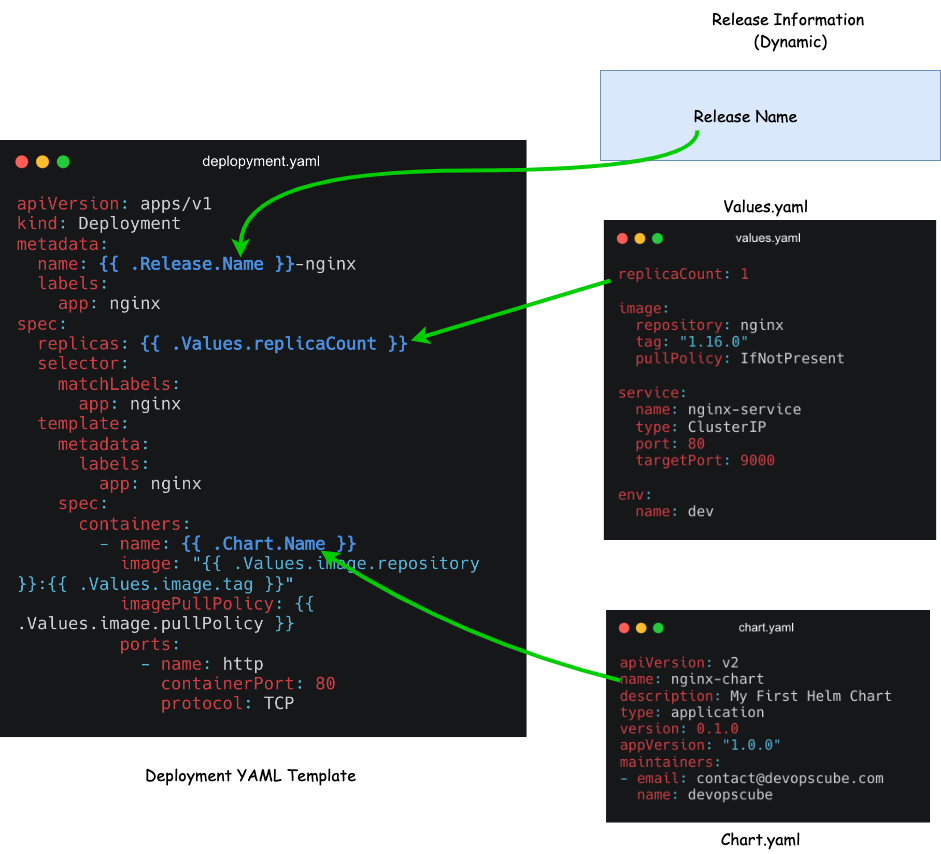
A chart contains all the necessary Kubernetes resource definitions, but with a crucial difference: they are templates, not static files. A central configuration file, values.yaml, provides the data that gets injected into these templates when you install or upgrade the chart.
This templating mechanism is what makes Helm so powerful.
A typical chart has a standardized directory structure.

2. Creating and Understanding Your First Chart
The best way to understand the structure is to create a chart yourself. Helm provides a command to generate a boilerplate chart, which is a great starting point.
helm create my-webapp
This command creates a my-webapp directory with the structure we saw above, pre-filled with an example NGINX deployment. While useful, the generated templates and values are quite complex. For learning, it's often clearer to start with our own simple Kubernetes manifests and convert them into a chart.
The following video walks through this exact process: creating a chart, cleaning out the boilerplate, adding basic Kubernetes manifests, and then systematically "templatizing" them.
How to Create Helm Charts - The Ultimate Guide
The video "How to Create Helm Charts - The Ultimate Guide" from DevOps Journey provides an excellent, practical walkthrough. We'll focus on the initial creation and templating process.
Please watch the following two segments: Chart Scaffolding and Structure (00:47 - 03:59): This part shows how to use helm create and then explains the purpose of the key files and directories, like Chart.yaml, values.yaml, and the templates/ folder. The instructor then clears out the default templates to prepare for a custom application, which is a common workflow. Introducing Templating (06:21 - 13:53): This is the most critical section. Pay close attention to how hardcoded values in the Deployment and ConfigMap manifests are replaced with template syntax like {{ .Values.appName }} and {{ .Values.image.tag }}. Observe how the corresponding key-value pairs are added to the values.yaml file. This demonstrates the fundamental link between your values file and the templates.
Key Templating Concepts
As you saw in the video, the process involves two main parts:
-
In your template files (
templates/*.yaml): You replace static values with Go template syntax. All of your configurable values will live under the.Valuesobject.- A simple value:
replicas: {{ .Values.replicaCount }} - A nested value:
image: "{{ .Values.image.repository }}:{{ .Values.image.tag }}"
- A simple value:
-
In your configuration file (
values.yaml): You define the default values using standard YAML structure. This file becomes the "API" for your chart.# values.yaml replicaCount: 1 image: repository: nginx tag: "1.16.0"
3. Customizing Configuration for Different Environments
The real power of Helm shines when you need to deploy the same application to multiple environments with different configurations. You don't create multiple copies of your chart; you create multiple values files.
You can provide a custom values file during installation or upgrade using the -f (or --values) flag. Helm uses a specific order of precedence for values:
- Values set via the
--setcommand-line flag (e.g.,helm install ... --set replicaCount=3). - Values from a file passed with the
-fflag (e.g.,helm install ... -f my-values.yaml). - The chart's own default
values.yamlfile.
A value set at a higher level overrides the same value from a lower level. This allows you to define sane defaults in your chart and override only what's necessary for a specific environment.
Let's see a practical demonstration of this.
How to Create Helm Charts - The Ultimate Guide
We'll continue with the same video, which now demonstrates how to create separate values files for 'dev' and 'prod' environments to deploy customized releases.
Please watch the segment Creating Environment-Specific Configurations (16:15 - 22:11). Notice how values-dev.yaml and values-prod.yaml are created. They don't contain all the values, only the ones that differ from the defaults. The instructor then uses helm install with the -f flag to deploy distinct releases for each environment, each with its own namespace, custom message, etc.
This workflow is central to DevOps practices using Kubernetes. You maintain one version-controlled chart for your application and separate, much simpler, version-controlled values files for each of your deployment environments.
For a text-based reference that covers this whole process, from creation to installation with overrides, this article is a great resource to bookmark.
How to Create Your First Helm Chart from Scratch
The guide "How to Create Your First Helm Chart from Scratch" on OneUptime provides a concise, step-by-step summary of everything we've discussed and practiced.
Skim through these sections to reinforce what you saw in the video: Step 1: Scaffold a New Chart: Shows the helm create command and the resulting structure. Step 3: Configure Default Values: Explains the role of values.yaml and provides a well-structured example. Step 4: Create the Deployment Template: Shows an example of a templated deployment.yaml file, referencing .Values. Step 8: Override Values at Install Time: This section is particularly relevant, showing both the --set and -f methods for customizing a release.
4. Best Practices for values.yaml
As you create more complex charts, the design of your values.yaml file becomes important for usability and maintainability. Here are a few best practices from the official Helm documentation:
-
Use camelCase for variable names:
replicaCountinstead ofreplica-countorReplicaCount. This avoids conflicts with Helm's built-in variables (which arePascalCase, like.Release.Name). -
Prefer flat over nested structures where possible: A flat structure is easier for users to override with the
--setflag. For example,--set servers.foo.port=80is more intuitive than--set servers[0].port=80. Use nesting only when it significantly improves readability for a large group of related variables. -
Document everything: Every property in your
values.yamlshould have a comment explaining what it does. This makes your chart much easier for others (and your future self) to use.# good documentation # replicaCount is the number of pods to run for this deployment. replicaCount: 2 # bad documentation # number of replicas replicaCount: 2
Conclusion
In this lesson, you've learned the fundamentals of packaging a Kubernetes application with Helm. You are now equipped to move beyond managing raw YAML files and can adopt a more scalable and professional workflow for application delivery.
Key Takeaways:
- Helm packages Kubernetes applications into charts, which are versioned and reusable bundles of templated manifests.
- The
helm createcommand scaffolds a new chart with a standard structure. values.yamlacts as the public API for your chart, defining all the default configurable parameters.- You can customize deployments for different environments by overriding default values using separate files (
-f my-values.yaml) or command-line flags (--set). - This approach separates the application definition (the chart) from its environment-specific configuration (the values).
What's Next?
So far, we've used simple value substitution. But what if you need more logic? For example, what if you only want to create an Ingress resource in the production environment, or you need to loop over a list of ports to create multiple container ports?
In the next lesson, we will dive deeper into Helm's templating engine. We will use Helm template functions and control structures (like if/else and range) to dynamically generate manifests, giving you precise control over your chart's output.