Hello! Welcome back to our module on the Kubernetes Ecosystem and Operations.
In the last lesson, we explored the power of GitOps, using ArgoCD to create a declarative, self-healing deployment pipeline. You learned how to make Git the single source of truth for your application's state. Now, we'll apply that same robust, version-controlled philosophy to a critical piece of your cluster's infrastructure: the monitoring stack.
This lesson directly addresses the learning outcome: Deploy and configure a Prometheus and Grafana stack for Kubernetes monitoring. We will use the industry-standard kube-prometheus-stack Helm chart to deploy a comprehensive observability solution. You'll not only learn how to install it but also how to configure it for your needs and understand the powerful operator pattern that makes it all work.
1. The Anatomy of a Kubernetes Monitoring Stack
Before we deploy anything, let's understand the components we're about to install. The kube-prometheus-stack isn't just one or two tools; it's a collection of services that work together to provide end-to-end monitoring.
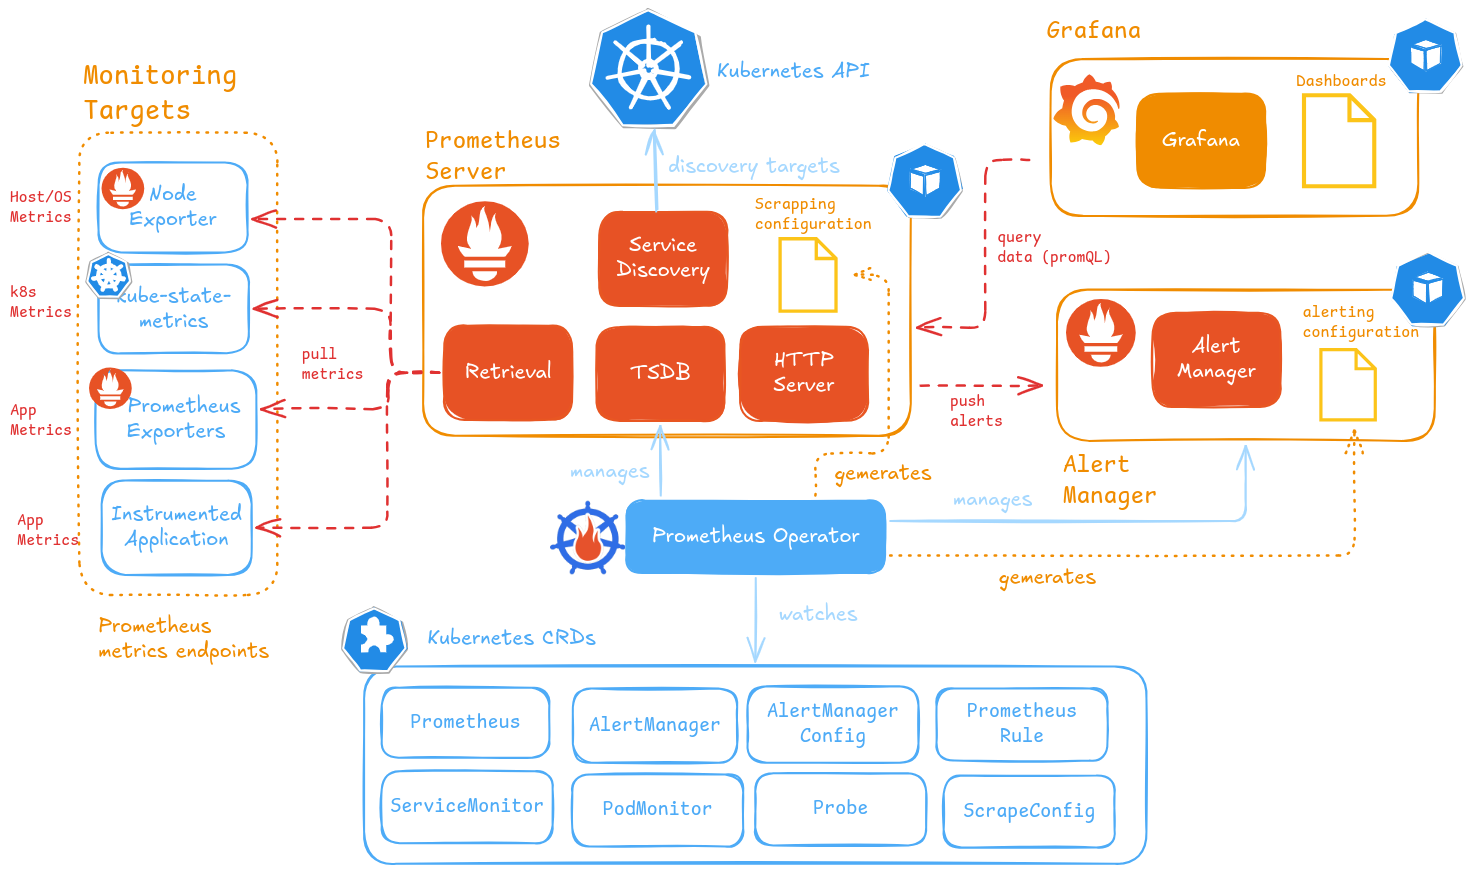
The key components in this architecture are:
- Prometheus: A time-series database that scrapes and stores metrics. It's the core of our monitoring solution.
- Grafana: A powerful visualization tool used to create dashboards from the data stored in Prometheus.
- Prometheus Operator: This is a crucial controller that simplifies the management of Prometheus on Kubernetes. Instead of manually editing complex configuration files, the operator allows you to manage Prometheus declaratively using Kubernetes Custom Resources like
ServiceMonitorandPrometheusRule. - Alertmanager: Handles alerts sent by Prometheus. It deduplicates, groups, and routes them to the correct receiver (like email, Slack, or PagerDuty).
- Exporters: These are services that expose metrics in a format Prometheus can understand. The stack includes two vital ones out of the box:
- Node Exporter: A DaemonSet that runs on every node to expose machine-level metrics (CPU, memory, disk, network).
- kube-state-metrics: A service that listens to the Kubernetes API and generates metrics about the state of objects like Deployments, Pods, and Services.
To get a detailed walkthrough of these components and how they fit together, the following video provides an excellent introduction.
Setup Prometheus Monitoring on Kubernetes using Helm and Prometheus Operator | Part 1
The video "Setup Prometheus Monitoring on Kubernetes" by TechWorld with Nana provides a fantastic breakdown of the components created by the Helm chart and explains their individual roles.
Please watch the following parts: Introduction to Components (00:00:00 - 00:03:11): This section gives a high-level overview of the main parts (Prometheus, Alertmanager, Grafana) and explains why using the Prometheus Operator via a Helm chart is the most efficient deployment method. Exploring the Created Components (00:04:14 - 00:19:15): This is a deep dive into all the Kubernetes resources created by the Helm chart. Pay close attention to the descriptions of the StatefulSets, Deployments (especially the Operator), and the Node Exporter DaemonSet. This will solidify your understanding of the architecture diagram above.
2. Deploying the kube-prometheus-stack with Helm
Now, let's get our hands dirty and deploy the stack. Given your experience with Helm, we'll use the official prometheus-community/kube-prometheus-stack chart.
Deploying Prometheus and Grafana with Helm
The article "Deploying Prometheus and Grafana with Helm" from OneUptime provides a clear, command-by-command guide for the installation process. We'll follow their basic installation steps.
Follow the commands under the headings "Add Repository" and "Basic Installation". This will add the required Helm repository and install the stack into a dedicated monitoring namespace.
After running the helm install command, you can verify that all the components are starting up by running:
kubectl get pods -n monitoring -w
It may take a few minutes for all pods to be in the Running state. Once they are, you have a fully functional monitoring stack!
3. Accessing and Exploring the Stack
With the stack running, let's access the UIs for Grafana and Prometheus to see what we get out of the box. We will use kubectl port-forward for local access. In a production environment, you would typically use an Ingress.
The video you watched earlier also demonstrates this process perfectly.
Setup Prometheus Monitoring on Kubernetes using Helm and Prometheus Operator | Part 1
Let's return to the TechWorld with Nana video to see a live demonstration of accessing the UIs and exploring the pre-built dashboards.
Watch the segment from 00:19:15 to 00:24:50. This will guide you through: Port-forwarding to the Grafana service. Finding the default admin password (though a more reliable method is shown below). Exploring the default dashboards for node and Kubernetes component metrics. Port-forwarding to the Prometheus UI to inspect scraped targets and configuration.
Getting the Grafana Admin Password
The default password for Grafana can be retrieved reliably with the following command:
kubectl get secret --namespace monitoring prometheus-grafana -o jsonpath="{.data.admin-password}" | base64 --decode ; echo
Log in to Grafana with the username admin and the password you just retrieved. You'll be amazed at the wealth of information available in the pre-configured dashboards.
4. Customizing the Deployment
A default installation is great for a demo, but for any real-world use case, you'll need to customize the configuration. This is done by providing a custom values.yaml file to the helm install or helm upgrade command.
Let's look at how to configure a few key areas: Prometheus metrics retention and adding a custom Grafana dashboard declaratively.
4.1 Prometheus Retention and Storage
By default, Prometheus may only store metrics for a short period. For production, you'll want to configure persistence and a longer retention policy.
Kubernetes Monitoring Best Practices: A Comprehensive Guide
The article "Kubernetes Monitoring Best Practices" from Trilio shows how to set these specific values in a custom Helm values file.
Read the section "Establish data retention policies". Focus on the example custom-values.yaml file that sets prometheus.prometheusSpec.retention and retentionSize. This section also shows the helm upgrade command needed to apply these changes.
4.2 Configuring Custom Dashboards with ConfigMaps
You can, and should, manage your Grafana dashboards declaratively. The kube-prometheus-stack chart is configured to automatically discover dashboards from ConfigMaps that have the label grafana_dashboard: "1".
Deploying Prometheus and Grafana with Helm
The OneUptime article has an excellent example of this pattern.
Review the section "Add Dashboards via ConfigMap". It provides a complete YAML manifest for a ConfigMap that defines a simple Grafana dashboard in JSON format. This is the GitOps-friendly way to manage your dashboards.
5. Monitoring Your Own Applications with ServiceMonitor
So far, we've monitored the cluster itself. But how do you tell Prometheus to scrape metrics from your own applications? This is where the Prometheus Operator and the ServiceMonitor CRD shine.
Instead of manually editing a central Prometheus configuration file, you create a ServiceMonitor resource in the same namespace as your application. This resource declaratively defines how Prometheus should find and scrape your application's metrics endpoint.
Prometheus, Grafana & Kubernetes: Installation + Monitoring
The video "Prometheus, Grafana & Kubernetes" from Rayan Labs provides a clear and practical demonstration of monitoring a custom application using a ServiceMonitor.
Watch the section "Application Monitoring" (00:13:57 - 00:24:13). This is a critical part of the lesson. It explains: How applications expose metrics. The concept of a ServiceMonitor CRD and how it binds to a Service using labels. How the Prometheus instance discovers the ServiceMonitor and begins scraping the application's metrics. How to visualize these new custom metrics in Grafana.
The key takeaway is this declarative, decoupled approach:
- Your application's deployment includes a
Servicewith a specific label (e.g.,app: my-fastapi-app). - You create a
ServiceMonitorthat uses aselectorto find services with that label. - The Prometheus Operator sees the
ServiceMonitorand automatically reconfigures the underlying Prometheus instance to start scraping the endpoints of the pods behind that service.
Conclusion
In this lesson, you've deployed a production-grade monitoring stack on Kubernetes. You've seen how the combination of Helm and the Prometheus Operator provides a powerful, declarative framework for managing observability.
Key Takeaways:
- The
kube-prometheus-stackHelm chart is the industry standard for deploying a comprehensive monitoring solution, including Prometheus, Grafana, and key exporters. - The Prometheus Operator is the engine that enables declarative management of the monitoring configuration through Custom Resource Definitions (CRDs).
ServiceMonitoris the CRD used to declaratively tell Prometheus how to discover and scrape metrics from your applications, fitting perfectly with the GitOps philosophy.- Grafana dashboards can and should be managed declaratively as code using ConfigMaps, allowing them to be version-controlled in Git.
What's Next?
You've now mastered collecting and visualizing metrics, one of the three pillars of observability. In the next lesson, "Deploy Fluent Bit as a DaemonSet for cluster-wide log collection and forwarding," we will tackle the second pillar: logging. You'll learn how to set up a lightweight, efficient agent to collect logs from all nodes and applications in your cluster and forward them to a central location.