Hello! Welcome back to our module on the Kubernetes Ecosystem and Operations.
In our previous lesson, you successfully deployed a full Prometheus and Grafana stack, giving you powerful capabilities for metrics collection and visualization—the first pillar of observability. We saw how the Prometheus Operator and the ServiceMonitor CRD provide a declarative, Kubernetes-native way to manage monitoring.
This lesson builds directly on that foundation by tackling the second pillar of observability: logging. We will deploy Fluent Bit, a lightweight and high-performance log processor, to create a centralized logging pipeline for your entire cluster.
Our goal is to deploy Fluent Bit as a DaemonSet for cluster-wide log collection and forwarding. You will learn how it automatically discovers and collects logs from all your applications, enriches them with valuable Kubernetes metadata, and forwards them to a destination of your choice.
1. The Role of a Log Agent in Kubernetes
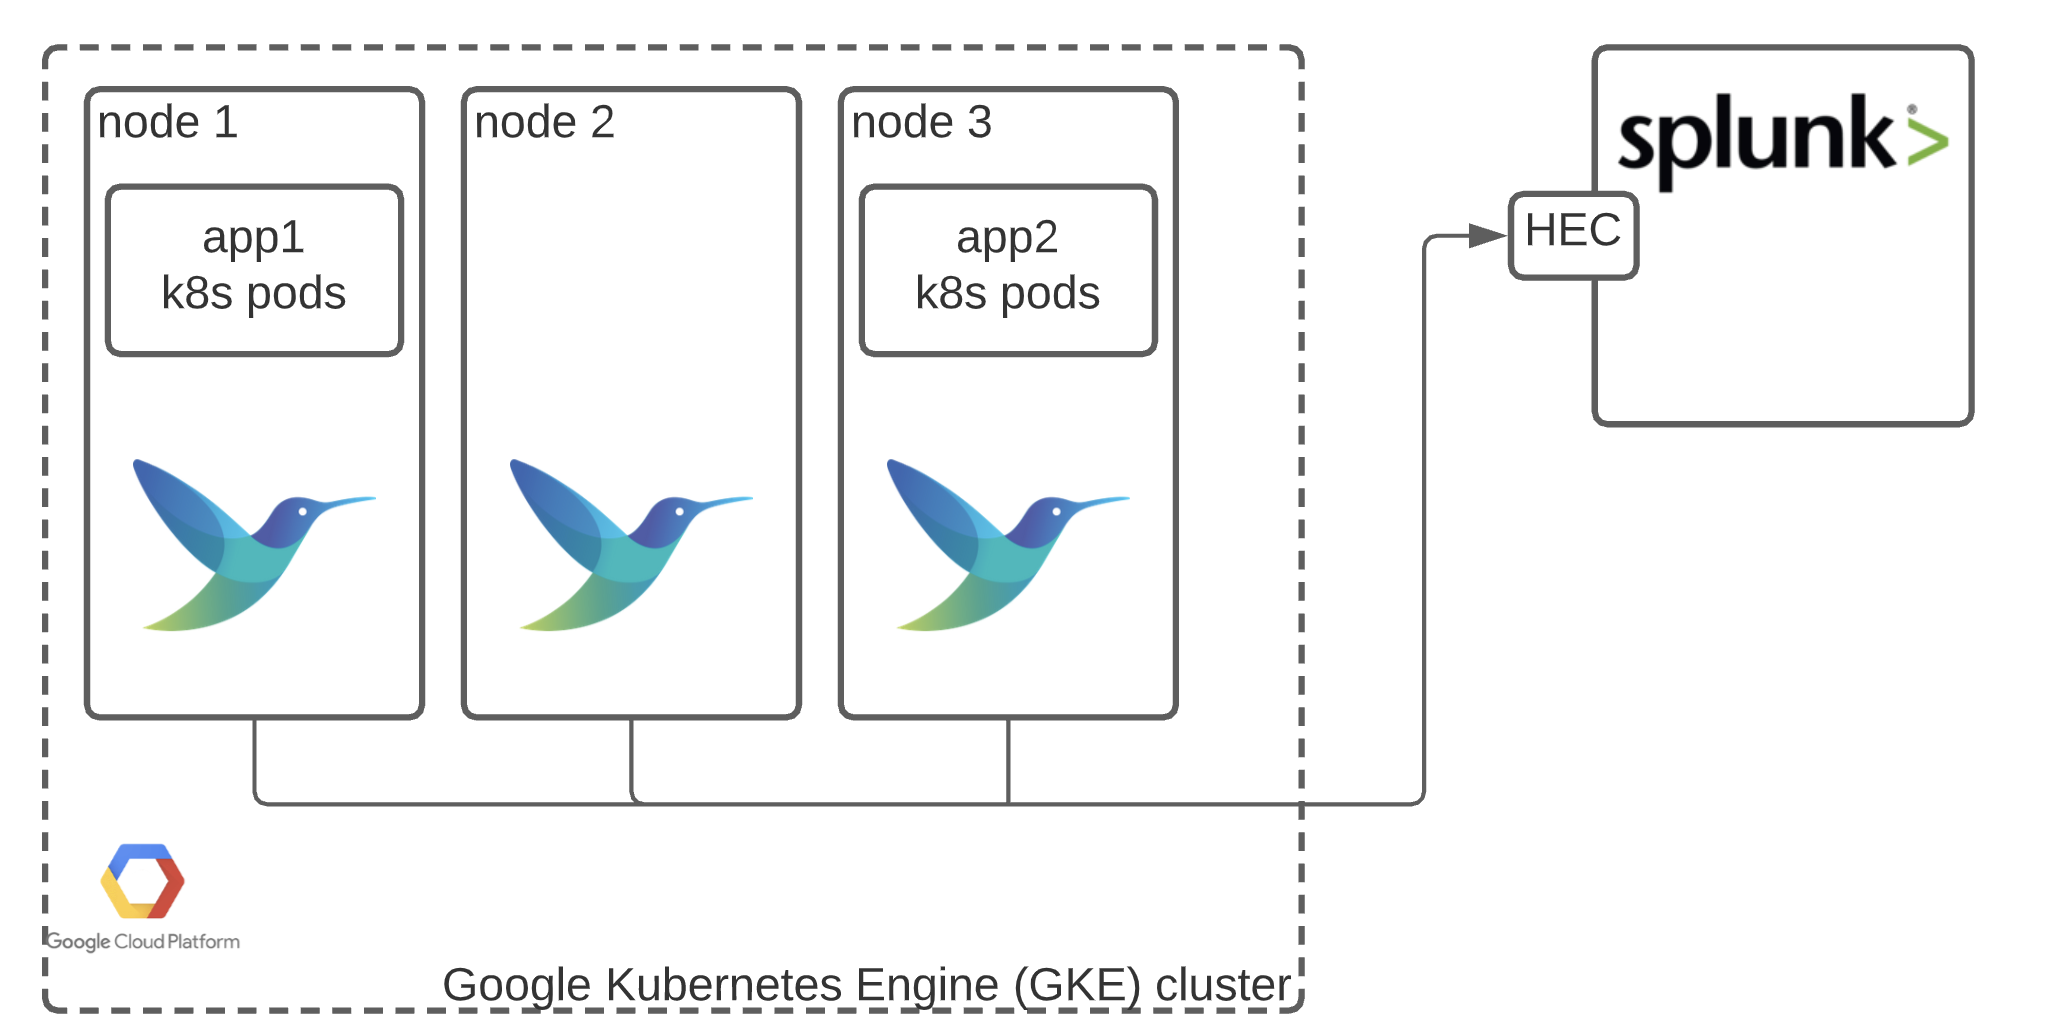
In a distributed system like Kubernetes, application logs are scattered across many nodes and containers. A log agent's job is to run on every node, collect these logs, process them, and ship them to a centralized logging backend (like Elasticsearch, Loki, or a cloud service like AWS CloudWatch Logs).
Fluent Bit is a CNCF-graduated project designed for this exact purpose. It's written in C, making it extremely lightweight and performant, which is critical for an agent that runs on every single node in your cluster.
To get a solid overview of Fluent Bit's architecture and its core components, the following video provides an excellent introduction.
Logging in Kubernetes | Fluent Bit | Observability | ADITYA JOSHI |
This video, "Logging in Kubernetes | Fluent Bit" by Aditya Joshi, clearly explains why logging is important in Kubernetes and breaks down the internal pipeline of Fluent Bit.
Please watch the following two segments: Introduction to Logging and Fluent Bit (00:00:00 - 00:01:46): This section covers the basics of logging in a distributed system and introduces Fluent Bit. Fluent Bit's Data Pipeline (00:02:23 - 00:04:04): This is a key section. Pay close attention to the explanation of the five stages: Input, Parser, Filter, Buffer, and Routing/Output. Understanding this pipeline is fundamental to configuring Fluent Bit effectively.
As you saw in the video, every log record flows through a configurable pipeline. This modular design allows you to tailor log processing to your specific needs.
2. The DaemonSet Deployment Model
Fluent Bit is almost always deployed as a DaemonSet in Kubernetes. This ensures that one Fluent Bit pod runs on every node in the cluster. This is the ideal model for a log agent because it needs access to the log files generated by containers on the node's local filesystem (typically located at /var/log/containers/*.log).
To function correctly, the Fluent Bit DaemonSet requires specific permissions:
- Volume Mounts: It needs to mount host directories like
/var/logto access container log files. - RBAC Permissions: It needs a
ServiceAccount,ClusterRole, andClusterRoleBindingto communicate with the Kubernetes API server. This allows it to fetch metadata about pods and nodes to enrich the logs—a process we'll explore in detail later.
The video you just watched begins to demonstrate a deployment using raw manifests. Let's watch the section that sets up these permissions and the main configuration.
Logging in Kubernetes | Fluent Bit | Observability | ADITYA JOSHI |
Continuing with the same video, let's see how the necessary RBAC resources and the core configuration (via a ConfigMap) are created.
Watch the segment from 00:04:04 to 00:13:14. Focus on understanding: Why a ServiceAccount, ClusterRole, and ClusterRoleBinding are necessary for Fluent Bit to get, list, and watch Kubernetes resources. How the ConfigMap is used to define the Fluent Bit pipeline configuration, including [INPUT], [PARSER], and [OUTPUT] sections. The configuration of the tail input plugin to read logs from /var/log/containers/*.log. The use of tags (kube.*) to route logs through the pipeline. The configuration of an elasticsearch output plugin as an example destination.
3. Deploying Fluent Bit with Helm
While applying raw manifests is a great way to understand the individual components, in a real-world scenario, you would use a Helm chart to manage the deployment. This aligns with the approach we took for the kube-prometheus-stack and makes managing configuration, upgrades, and dependencies much easier.
We will use the official Fluent Bit Helm chart to deploy our logging agent.
How to Set Up Centralized Logging in Kubernetes with Fluent Bit
The article "How to Set Up Centralized Logging in Kubernetes with Fluent Bit" from OneUptime provides a clear, production-oriented guide for deploying Fluent Bit using its Helm chart. We'll follow its steps.
Read the sections titled "Step 1: Install Fluent Bit with Helm" and "Step 4: Deploy Fluent Bit". Execute the commands to add the fluent Helm repository, create a logging namespace, and install the chart. We will create our own configuration in the next step, so for now, you can skip the creation of the values file and run the basic install command.
Here are the commands for your convenience:
# 1. Add the Fluent Bit Helm repository
helm repo add fluent https://fluent.github.io/helm-charts
helm repo update


# 2. Create a namespace for logging components
kubectl create namespace logging


# 3. Install the chart (we will configure it properly in a moment)
helm install fluent-bit fluent/fluent-bit --namespace logging
After installation, you can verify that the DaemonSet has scheduled a pod on each of your cluster's nodes:
kubectl get pods -n logging -l app.kubernetes.io/name=fluent-bit -o wide
4. Enriching Logs with the Kubernetes Filter
The single most powerful feature of Fluent Bit in a Kubernetes environment is its ability to enrich logs with metadata. A raw log line like Payment processed successfully is not very useful without knowing which application, which pod, and which container produced it.
This is where the Kubernetes Filter comes in. It automatically adds context like pod name, namespace, labels, and annotations to every log record.
Let's see a practical demonstration of its impact.
Logging in Kubernetes | Fluent Bit | Observability | ADITYA JOSHI |
Let's return to the Aditya Joshi video one last time. He does an excellent job of showing the difference in log quality before and after enabling the Kubernetes filter.
Watch the final demonstration from 00:21:45 to 00:25:05. Observe how adding the [FILTER] section for Kubernetes to the ConfigMap transforms the logs from simple messages into richly-detailed records containing kubernetes.pod_name, kubernetes.container_image, and other essential fields.
5. Creating a Production-Ready Configuration
Now, let's combine everything we've learned to create a robust configuration for Fluent Bit and apply it using Helm.
Create a file named fluent-bit-values.yaml. This file will tell the Helm chart how to configure the Fluent Bit DaemonSet and its associated resources.
fluent-bit-values.yaml
# Run on all nodes, including control plane
tolerations:
  - operator: Exists


# Configure the pipeline via a ConfigMap
config:


  # Define inputs, filters, and outputs
  inputs: |
    [INPUT]
        Name              tail
        Tag               kube.*
        Path              /var/log/containers/*.log
        Parser            cri
        DB                /var/log/flb_kube.db
        Mem_Buf_Limit     5MB
        Skip_Long_Lines   On
        Refresh_Interval  10

  filters: |
    [FILTER]
        Name                kubernetes
        Match               kube.*
        Kube_URL            https://kubernetes.default.svc:443
        Kube_CA_File        /var/run/secrets/kubernetes.io/serviceaccount/ca.crt
        Kube_Token_File     /var/run/secrets/kubernetes.io/serviceaccount/token
        Kube_Tag_Prefix     kube.var.log.containers.
        Merge_Log           On
        Keep_Log            Off
        K8S-Logging.Parser  On
        K8S-Logging.Exclude On

    [FILTER]
        Name record_modifier
        Match *


        # Remove noisy and redundant fields
        Remove_key logtag
        Remove_key stream

  outputs: |
    [OUTPUT]
        Name   stdout
        Match  *


  # Define the parsers used in the input section
  parsers: |
    [PARSER]
        Name   cri
        Format regex
        Regex  ^(?<time>[^ ]+) (?<stream>stdout|stderr) (?<logtag>[^ ]*) (?<log>.*)$
        Time_Key time
        Time_Format %Y-%m-%dT%H:%M:%S.%L%z
Let's break down this configuration:
tolerations: Allows Fluent Bit to be scheduled on control-plane nodes, ensuring complete log coverage.config.inputs: Uses thetailinput to read all container logs. Thecriparser is specified to handle the log format used bycontainerd.config.filters:- The
kubernetesfilter enriches logs with metadata.Merge_Log Oncleverly merges the actual log message into the top-level JSON object. - The
record_modifierfilter cleans up the output by removing redundant fields.
- The
config.outputs: For this exercise, we use thestdoutoutput, which simply prints the processed logs to the Fluent Bit pod's standard output. This is perfect for learning and debugging.
Now, apply this configuration using helm upgrade:
helm upgrade --install fluent-bit fluent/fluent-bit \
  --namespace logging \
  -f fluent-bit-values.yaml
To see the processed, enriched logs in real-time, you can tail the logs of one of the fluent-bit pods:
# Get the name of a fluent-bit pod
POD_NAME=$(kubectl get pods -n logging -l app.kubernetes.io/name=fluent-bit -o jsonpath='{.items[0].metadata.name}')


# Tail its logs
kubectl logs -n logging $POD_NAME -f
You will see a structured JSON output for every log line generated in your cluster, now enriched with Kubernetes context!
6. Forwarding to a Real Backend (Example: AWS CloudWatch)
The stdout output is great for testing, but in production, you'll forward logs to a durable backend. Fluent Bit's plugin architecture makes this a simple configuration change.
Given your strong AWS background, let's look at how you would configure Fluent Bit to send logs to Amazon CloudWatch. You don't need to implement this now, but it's important to see how the pattern works.
Integrate Fluent Bit into CloudWatch Container Insights for Amazon EKS | Amazon Web Services
The video "Integrate Fluent Bit into CloudWatch Container Insights" from AWS demonstrates this exact use case for an EKS cluster.
Watch the short segment from 00:01:22 to 00:03:02. This shows how to deploy a pre-configured Fluent Bit DaemonSet that forwards logs to CloudWatch. Notice that the core principle is the same: deploy a DaemonSet with the right permissions and configuration. The only major difference is the [OUTPUT] section of the ConfigMap is configured for CloudWatch instead of stdout.
This principle applies to any backend. To send logs to Loki, you would use the loki output plugin. For Elasticsearch, the es plugin. The pipeline structure remains the same, showcasing the power and flexibility of Fluent Bit.
Conclusion
Congratulations! You have now deployed a cluster-wide logging agent and configured a complete log processing pipeline. This is a fundamental capability for operating any production Kubernetes cluster.
Key Takeaways:
- Fluent Bit is a lightweight, high-performance log processor ideal for Kubernetes.
- It is deployed as a DaemonSet to ensure it runs on every node and can access local container log files.
- The log processing pipeline consists of Inputs, Parsers, Filters, and Outputs, which are configured in a
ConfigMap. - The
kubernetesfilter is essential for enriching logs with metadata (pod name, namespace, labels), making them searchable and useful. - Helm is the recommended tool for managing a Fluent Bit deployment, allowing you to manage its complex configuration declaratively.
What's Next?
So far, we have covered metrics (Prometheus) and logging (Fluent Bit). The third pillar of observability is tracing. In the next lesson, we will dive into this topic by exploring service meshes. You will learn to explain the purpose of a service mesh and deploy a simple application with Linkerd to observe traffic, giving you insight into request flows and latencies between your microservices.