Hello! Welcome to the final lesson in our module on the Kubernetes Ecosystem and Operations.
In the previous lessons, we built the first two pillars of observability for our cluster: metrics with Prometheus and Grafana, and logging with Fluent Bit. You learned how to deploy these tools as core platform services to gain insight into system and application behavior.
This lesson completes our observability trifecta by introducing the concept of a service mesh. We'll focus on the "why" behind this powerful technology and then get hands-on with Linkerd, a popular, lightweight service mesh.
Our goal is to explain the purpose of a service mesh and deploy a simple application with Linkerd to observe traffic. This will give you insight into request flows, service dependencies, and performance—the kind of visibility that is crucial for debugging and operating complex microservice architectures.
1. The Challenge of Microservice Communication
As you know from your experience, Kubernetes provides fundamental networking capabilities: it gives pods an IP address and allows them to communicate via Services. However, as systems scale, managing the communication between services becomes complex. Developers often find themselves repeatedly building the same non-functional logic into every single microservice:
- Reliability: How do you handle transient network failures? You need to implement retries and timeouts.
- Security: How do you ensure that traffic between services is encrypted and that services can verify each other's identity? You need to set up mutual TLS (mTLS).
- Observability: How do you get consistent metrics on success rates, request volumes, and latencies for every service? You need to add instrumentation code.
- Traffic Control: How do you safely roll out a new version of a service using a canary deployment or perform A/B testing? You need to build complex routing logic.
Implementing this logic in every service, across different languages and frameworks, is inefficient and error-prone. This is the problem a service mesh aims to solve.
To get a clear picture of these challenges, let's watch a short video. While it uses Istio as an example, the initial conceptual overview is excellent and applies to any service mesh.
Istio & Service Mesh - simply explained in 15 mins
This video, "Istio & Service Mesh - simply explained in 15 mins" from TechWorld with Nana, provides a great introduction to the problems that lead to the need for a service mesh.
Please watch the segment from 00:00:33 to 00:05:15. Focus on the list of challenges presented: service discovery, security, retry logic, and metrics. Notice how these responsibilities add complexity directly to the application code.
2. The Service Mesh Solution: Sidecar Proxies
A service mesh moves all that complex network communication logic out of the application and into a dedicated infrastructure layer composed of a network of proxies.
This is implemented using the sidecar pattern. For each pod in your application, the service mesh automatically injects a proxy container (the "sidecar") right next to your application container. All network traffic into and out of your application container is transparently routed through this proxy.

These proxies form the Data Plane. They are controlled by a central Control Plane, which you, the operator, interact with. The control plane provides an API to configure the behavior of all the proxies—for example, setting retry policies, defining traffic-splitting rules, or managing security certificates.
This architecture has two major benefits:
- Developers can focus on business logic. They no longer need to write boilerplate code for mTLS, retries, or metrics instrumentation.
- Platform operators get centralized control. You can enforce consistent security and reliability policies across all services in the mesh, regardless of the language they're written in.
3. Introducing Linkerd
Linkerd is a CNCF-graduated service mesh known for its simplicity, performance, and low resource footprint. Unlike more complex service meshes like Istio, Linkerd is designed to be incredibly easy to install and provides critical features like mTLS and live traffic observability "out of the box" with zero configuration.
Linkerd's core value is providing immediate observability through what are often called the "golden metrics" or RED metrics:
- (R)ate: The number of requests per second.
- (E)rrors: The number of failed requests per second.
- (D)uration: The distribution of latencies for requests.
By observing traffic at the proxy layer, Linkerd can automatically collect these metrics for all HTTP, gRPC, and TCP traffic without requiring any changes to your application code.
Kubernetes observability with a service mesh
This article, "Kubernetes observability with a service mesh" from Buoyant (the creators of Linkerd), provides a concise explanation of golden metrics and Linkerd's role in providing them.
Read the introduction and the section titled "What are golden metrics and why are they important?". This will solidify your understanding of the immediate observability value a service mesh like Linkerd provides.
Now, let's put this theory into practice.
4. Lab: Deploying Linkerd and Observing Traffic
In this lab, we will install Linkerd, deploy a demo application, and use Linkerd's tools to observe its traffic. The following video provides a complete walkthrough of this process. We will follow its steps, and I will provide the commands for you to execute.
What Is Linkerd Kubernetes Service Mesh? Linkerd Tutorial Part 1
The video "What Is Linkerd Kubernetes Service Mesh?" from DevOps & AI Toolkit will be our guide for this lab. It walks through the entire process from installation to traffic observation.
We will be following the steps shown in this video from 00:05:51 to 00:20:10. You can watch it through first, or watch it section by section as we perform the steps below.
Step 4.1: Install the Linkerd CLI and Control Plane
First, we need the linkerd CLI on your local machine to interact with the cluster. Then, we'll run a pre-check and install the control plane.
# Install the Linkerd CLI
curl --proto '=https' --tlsv1.2 -sSfL https://run.linkerd.io/install | sh
export PATH=$HOME/.linkerd2/bin:$PATH
linkerd version


# Validate that your cluster is ready for Linkerd
linkerd check --pre


# Install the Linkerd Custom Resource Definitions (CRDs)
linkerd install --crds | kubectl apply -f -


# Install the Linkerd control plane
linkerd install | kubectl apply -f -


# Verify the installation. Wait until all checks pass.
linkerd check
(These steps correspond to the video from 00:06:00 to 00:08:40)
Step 4.2: Install the Viz Extension
The viz extension provides the on-cluster metrics stack, including the web dashboard and Grafana dashboards.
# Install the viz extension
linkerd viz install | kubectl apply -f -


# Check that the viz extension components are running
linkerd check
(This step corresponds to the video from 00:08:46 to 00:10:02)
Step 4.3: Deploy and "Mesh" a Demo Application
Now we'll deploy Linkerd's emojivoto demo application. Then, we will "mesh" it, which means we'll trigger a rolling restart of its pods, and Linkerd's admission controller will automatically inject the sidecar proxy into each one.
# Deploy the emojivoto application
curl --proto '=https' --tlsv1.2 -sSfL https://run.linkerd.io/emojivoto.yml \
  | kubectl apply -f -


# Wait for the application to be running (all pods should show 1/1 containers)
kubectl get pods -n emojivoto


# "Inject" the Linkerd proxy into the application's deployments
kubectl get deploy -n emojivoto -o yaml \
  | linkerd inject - \
  | kubectl apply -f -


# Verify the injection. The pods will restart.
# Once ready, they should show 2/2 containers (app + linkerd-proxy).
kubectl get pods -n emojivoto
(This process is shown in the video from 00:10:02 to 00:13:15)
The linkerd inject command is a key part of the workflow. It reads a Kubernetes manifest, adds the linkerd.io/inject: enabled annotation to the pod spec, and outputs the modified manifest. When kubectl apply sends this to the API server, a Linkerd webhook intercepts the request and adds the linkerd-proxy and linkerd-init containers to the pod definition before it's scheduled.
Step 4.4: Observe the Traffic
With the application meshed, Linkerd is now collecting metrics. Let's use Linkerd's CLI and dashboard to see them.
First, let's look at the "golden metrics" for the deployments in the emojivoto namespace.
# See high-level stats for the emojivoto namespace
linkerd -n emojivoto stat deployments
You'll see a table with success rates, requests per second (RPS), and latency percentiles for each deployment.
Now, launch the Linkerd dashboard to explore this data visually.
# Launch the dashboard in your browser
linkerd viz dashboard &
In the dashboard, navigate to the emojivoto namespace. You'll see a service topology graph and the same live metrics you saw in the CLI. Click on one of the deployments, like web, to see its inbound and outbound traffic sources and live request data.
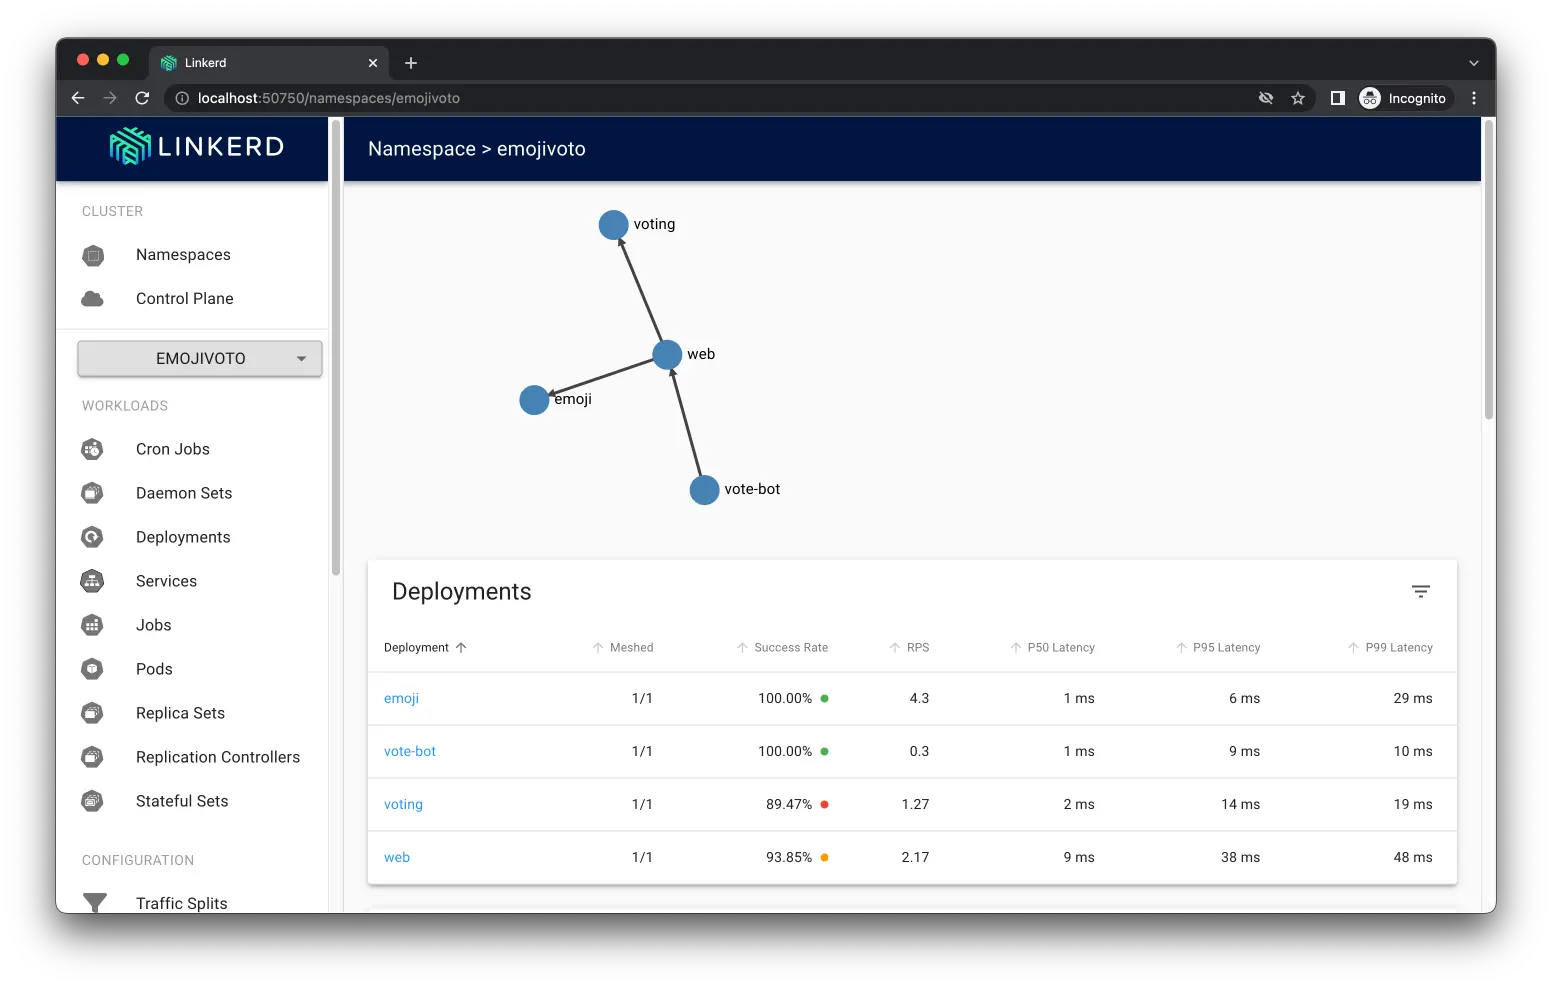
(The video demonstrates using the CLI and dashboard from 00:14:59 to 00:20:10)
Conclusion
Congratulations! You have successfully deployed a service mesh, meshed an application, and observed its live traffic patterns. You've seen firsthand how a service mesh provides a powerful layer of observability without requiring any application code changes.
Key Takeaways:
- A service mesh is a dedicated infrastructure layer for managing service-to-service communication, abstracting away concerns like reliability, security, and observability from applications.
- It works by injecting a sidecar proxy into each application pod to intercept all network traffic.
- Linkerd is a lightweight, easy-to-use service mesh that provides immediate value through out-of-the-box mTLS and observability of "golden metrics" (Rate, Errors, Duration).
- You can observe service health and performance using both the
linkerdCLI (stat,top) and the powerfullinkerd vizdashboard.
This lesson concludes our deep dive into the Kubernetes ecosystem and operations. You have built a robust platform with monitoring, logging, and now, service mesh observability—three essential pillars for running production workloads.
What's Next?
Having mastered a wide range of advanced DevOps tools and practices, our final module, DevOps Interview and Career Strategy, will focus on a different but equally important skill: articulating your expertise. We will begin by learning how to structure compelling behavioral interview answers using the STAR method, tailored specifically to DevOps scenarios.