Hello! Welcome to your next lesson in the "Advanced Debugging and System Profiling" module.
In our last session, we delved into perf, the Linux kernel's powerful sampling profiler. We learned how to identify CPU hotspots and diagnose complex cache coherency issues like false sharing. perf is excellent for answering the question, "Where is my program spending its time?"
Today, we're going to explore a complementary tool: ftrace. While perf samples the system to build a statistical picture of performance, ftrace is a tracer. It records every single event you're interested in, allowing you to answer the question, "What was the exact sequence of events that led to this behavior?" This capability is indispensable for debugging complex kernel interactions, understanding driver behavior, and analyzing real-time performance.
Your learning outcome for this lesson is to: Trace kernel function execution and measure interrupt latency using ftrace.
Mastering ftrace is a critical skill for roles at semiconductor companies, where you'll often need to debug interactions between custom drivers, the kernel scheduler, and hardware. We will cover how to trace kernel functions to understand code flow and then apply this knowledge to a classic embedded systems problem: measuring and analyzing interrupt latency.
1. ftrace Fundamentals: The Kernel's Built-in Narrator
ftrace is the official tracing framework of the Linux kernel. It provides a window into the kernel's inner workings by dynamically hooking into functions and events.
To get started, let's watch a segment from a talk by Steven Rostedt, the creator of ftrace. He provides the best high-level overview of what ftrace is and how you interact with it.
Kernel Recipes 2017 - Understanding the Linux Kernel via Ftrace - Steven Rostedt
This video introduces the core concepts of ftrace, explaining its purpose and how to access its controls through a special filesystem.
Watch the segment from 01:27 to 05:52. Focus on: The purpose of ftrace: to expose what's happening inside the kernel. How to access it: through the tracefs filesystem, typically mounted at /sys/kernel/tracing. The design philosophy: using simple shell commands like echo and cat for interaction, which is ideal for resource-constrained embedded environments.
The tracefs Filesystem
As you just saw, you control ftrace by reading from and writing to files in the /sys/kernel/tracing directory. This is similar to how /proc and /sys expose other kernel information.
Before we proceed, make sure this directory exists on your system. Most modern Linux distributions enable ftrace by default.
# You'll need root privileges for most ftrace operations
sudo -s


# Navigate to the ftrace directory
cd /sys/kernel/tracing


# List the contents
ls
You should see a collection of files and directories, including available_tracers, current_tracer, and trace. These are the three most fundamental files we'll be working with:
available_tracers: Lists the tracers compiled into your kernel.current_tracer: Shows the currently active tracer and allows you to select a new one.trace: This is the ring buffer where the trace output is stored. You read this file to see the results.
2. Tracing Kernel Function Execution
Let's begin with the first part of our learning outcome: tracing the flow of kernel functions. This is invaluable for understanding how a system call is implemented, what a driver does when it receives an I/O request, or how the scheduler makes decisions.
The function and function_graph Tracers
ftrace provides two primary tracers for this purpose:
function: Traces the entry of every function call. It's fast and provides a linear sequence of calls.function_graph: Traces both the entry and exit of functions. It generates a C-like, indented call graph that also shows the execution time of each function and its children. This is often more intuitive for understanding code flow.
This video provides a clear, practical demonstration of enabling these tracers and interpreting their output.
Let's see the function and function_graph tracers in action. This tutorial provides a step-by-step guide.
Watch from 11:35 to 24:39. Pay attention to: The command to enable a tracer: echo function_graph > current_tracer. The command to view the output: cat trace. The difference in output format between the function and function_graph tracers. How to read the function_graph output, including the meaning of curly braces {}, semicolons ;, and the execution duration.

The Challenge: Taming the Data Flood
If you enable the function tracer on an active system, you'll be flooded with millions of events per second. The trace buffer will overflow almost instantly, making it useless.
The key to using ftrace effectively is filtering.
ftrace provides powerful mechanisms to trace only what you're interested in. You can filter by:
- Function Name: Using
set_ftrace_filter. Wildcards are supported (e.g.,*spin_lock*). - Process ID (PID): Using
set_ftrace_pid. This is perfect for seeing what the kernel does on behalf of a specific application. - Kernel Module: Using the
:mod:syntax. This is extremely useful for debugging a specific driver you're working on.
Now, let's learn how to apply filters to focus our tracing efforts. This is the most important practical skill for using ftrace.
Please watch these two segments: Filtering by Function (24:39 - 43:43): This covers set_ftrace_filter and set_ftrace_notrace with wildcards. Notice how you can narrow down the trace to only vfs_* functions, for example. Filtering by PID and Module (01:03:52 - 01:14:14): This demonstrates the highly practical scenarios of tracing a single process or all the functions within a specific kernel module (like a network driver).
3. Measuring Interrupt Latency
Now we'll apply these skills to a critical real-time performance metric: interrupt latency. This refers to the time from when a hardware interrupt is asserted to when the specific handler begins to execute. A closely related and equally important metric is interrupts-disabled time, as long periods with interrupts disabled can cause other critical interrupts to be missed.
This is a very common topic in interviews for embedded and real-time roles. A typical question might be: "Your system is missing deadlines. You suspect long ISRs or other kernel code running with interrupts disabled. How would you prove it?"
ftrace gives you two excellent ways to do this.
Method 1: The irqsoff Tracer
The irqsoff tracer is purpose-built to find the longest continuous period during which interrupts were disabled on a CPU. It's simple and direct.
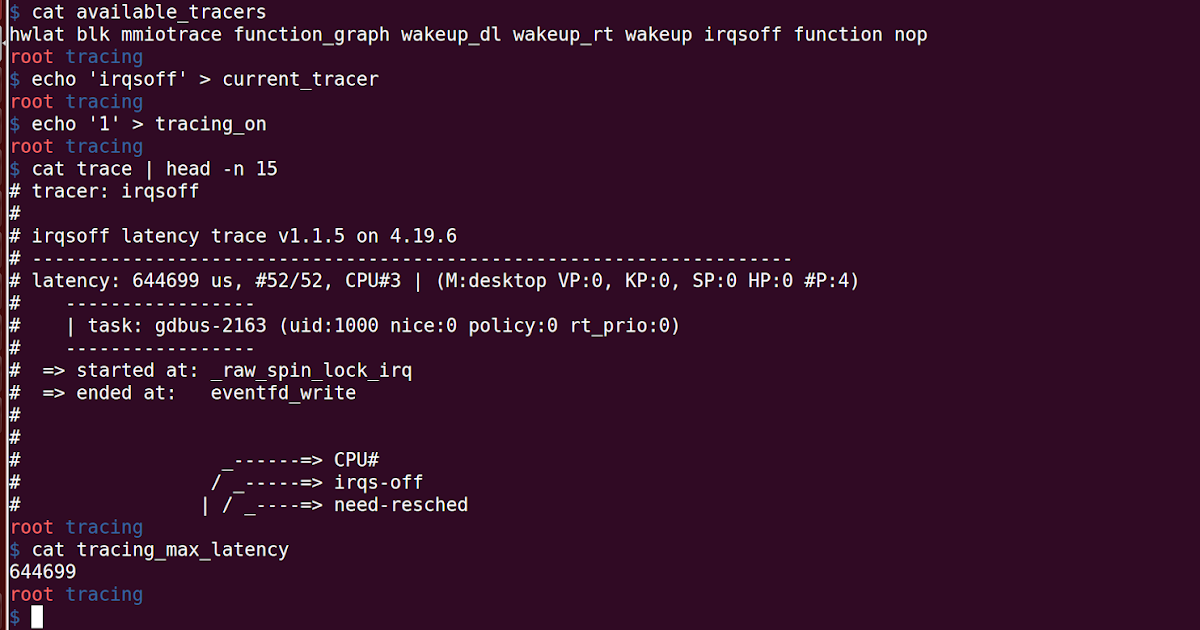
Here's the workflow:
- Select the tracer:
echo irqsoff > current_tracer - Start tracing:
echo 1 > tracing_on - Run your workload that you suspect is causing issues.
- Stop tracing and check the results:
echo 0 > tracing_on
cat tracing_max_latency  # Shows the longest duration in microseconds
cat trace                # Shows the detailed function trace for that longest duration
This instantly tells you the worst-case latency and the exact code path responsible for it.
Method 2: Graphing Interrupt Handlers
The irqsoff tracer is great for finding the single worst offender. But what if you want to know the duration of every interrupt? The function_graph tracer combined with a filter is perfect for this.
The kernel function do_irq is the high-level entry point for handling hardware interrupts. By tracing its graph, we can measure the execution time of our ISRs.
This video clip demonstrates exactly how to combine the function_graph tracer with a filter to measure interrupt latencies.
Watch the short segment from 35:12 to 36:13. It shows the precise commands to get this information.
The workflow is as follows:
- Set the filter to the main IRQ entry point:
echo do_IRQ > set_ftrace_filter # Note: The function name might be do_irq on older kernels. - Select the graph tracer:
echo function_graph > current_tracer - Start tracing, run your workload, stop tracing, and
cat trace.
The output will be a series of call graphs, one for each interrupt that occurred. The top-level function in each graph will be do_IRQ, and its duration (shown on the closing brace }) represents the total time spent handling that interrupt. This is a powerful way to get a statistical view of your system's interrupt behavior.
Conclusion
You have now learned how to use ftrace, a fundamental tool for kernel-level debugging and performance analysis. Unlike perf, which gives you a statistical summary, ftrace provides a complete, ordered log of events, allowing you to reconstruct precisely what the kernel was doing.
Key Takeaways:
ftraceis a kernel tracing framework accessed via thetracefsfilesystem at/sys/kernel/tracing.- The
function_graphtracer provides an intuitive, C-like call graph of kernel execution, including function durations. - Filtering is essential. Use
set_ftrace_filter,set_ftrace_pid, and:mod:syntax to isolate the events you care about and avoid being overwhelmed by data. - To measure the single longest time with interrupts disabled, use the
irqsofftracer and check thetracing_max_latencyfile. - To analyze the duration of all interrupts, combine the
function_graphtracer with a filter ondo_IRQ.
This lesson concludes our module on "Advanced Debugging and System Profiling." You are now armed with a powerful suite of tools—GDB, Valgrind, perf, and ftrace—to tackle correctness, memory safety, and performance issues across the software stack.
Preview of the Next Module:
Having honed our analysis skills, we will now shift our focus to design. In the next module, "System Design for Embedded Applications," we will start by architecting a foundational component for any portable embedded project: the Hardware Abstraction Layer (HAL). The insights you've gained into kernel execution will be invaluable as we design clean, efficient interfaces between application logic and low-level hardware drivers.