Hello! Welcome to the next lesson in our "Advanced Debugging and System Profiling" module.
In our last lesson, we focused on detecting and preventing stack overflows in RTOS and bare-metal environments using stack painting and MPU guard regions. These are indispensable techniques for ensuring reliability at the lowest levels of the system.
Today, we move up the software stack to the world of user-space applications, which are prevalent in complex embedded systems running Linux. Memory bugs in user space can be just as insidious as those in the kernel, causing silent data corruption, instability, and security vulnerabilities. As an experienced developer, you know that printf debugging and manual code inspection are often insufficient for catching these elusive errors. This is where automated, powerful tools become essential.
Your learning outcome for this lesson is to: Detect memory bugs in user-space applications using Valgrind or AddressSanitizer (ASan).
We will explore these two industry-standard tools, focusing not just on how to use them, but more importantly, on how they work and the critical trade-offs between them—the kind of in-depth knowledge expected in senior engineering interviews at companies like Qualcomm and Nvidia.
1. The Two Philosophies of Memory Debugging
At a high level, Valgrind and AddressSanitizer represent two different approaches to finding memory errors:
- Valgrind (Dynamic Binary Instrumentation): It acts like a virtual machine, inspecting your program's machine code as it runs. It requires no changes to your source code or compilation process.
- AddressSanitizer (Compile-Time Instrumentation): It's a compiler feature. The compiler injects special checking code directly into your binary during compilation.
This fundamental difference has profound implications for performance, bug detection capabilities, and when you would choose to use each tool.
2. Valgrind: The Universal Binary Inspector
Valgrind is a suite of dynamic analysis tools, with Memcheck being the most famous for memory error detection. Because it works on the final compiled binary, its greatest strength is that you can run it on any program, even if you don't have the source code.
How Valgrind Works
Valgrind's Memcheck tool operates through a process called dynamic binary instrumentation. It essentially takes your program's machine code and runs it on a synthetic CPU, instruction by instruction. Before executing each memory access, Valgrind can check if the operation is valid. This allows it to track every byte of memory, keeping a record of whether it's allocated, initialized, or freed.
Using Valgrind's Memcheck
Let's see how Valgrind is used to find two of the most common and dangerous bugs: a buffer overrun and a memory leak.
Find Memory Leaks and Buffer Overrun Using Valgrind and AddressSanitizer (ASAN)
This video from Undo provides a concise, practical demonstration of using both Valgrind and ASan. Let's start with the Valgrind sections to see it in action.
Please watch the following two segments: Heap Buffer Overrun with Valgrind (00:41 - 02:36): Observe how a simple command (valgrind ./your_program) is used to run the program and how Memcheck provides a precise report, including the line number of the invalid write. Memory Leak with Valgrind (06:40 - 07:35): Watch how Valgrind detects a memory leak and how the --leak-check=full flag provides a detailed report showing where the leaked block was allocated.
As you saw, Valgrind's reports are highly informative. With debugging symbols (-g), they point you directly to the source of the problem.

Valgrind Trade-offs
-
Pros:
- No Recompilation: It can run on any executable, making it ideal for debugging third-party libraries or production binaries you can't easily rebuild.
- Tool Suite: Valgrind includes other powerful tools like Cachegrind (cache profiler), Helgrind (threading bug detector), and Massif (heap profiler).
-
Cons:
- Performance Overhead: The dynamic instrumentation process is very slow, often causing a 10-50x slowdown. This can make it impractical for large applications or extensive test suites.
- Can Miss Some Bugs: Because it has no access to source code context, it can sometimes struggle to detect overflows of stack or global variables. The video touched on this when Valgrind missed the stack buffer overrun.
3. AddressSanitizer (ASan): The Compiler's Watchdog
AddressSanitizer is a newer, faster technology integrated directly into modern compilers like GCC and Clang. It has become the de facto standard for memory safety checking during development.
How ASan Works: Shadow Memory and Redzones
ASan's magic comes from two core concepts: compiler instrumentation and shadow memory.
- Instrumentation: When you compile with
-fsanitize=address, the compiler inserts checks before every memory access (read or write) in your code. - Shadow Memory: ASan reserves a large region of virtual memory to create a "shadow map" of your application's entire address space. Each byte in this shadow map corresponds to an 8-byte granule in your application's memory and stores its state (e.g., accessible, freed, out-of-bounds).
- Redzones: ASan also pads your heap, stack, and global variables with small, "poisoned" memory areas called redzones.
When your program runs, the instrumented code checks the shadow map before each memory access. If the code tries to touch a poisoned byte (like in a redzone or a freed block), the check fails, and ASan immediately terminates the program with a detailed report.
Understanding AddressSanitizer: Better memory safety for your code
The Trail of Bits blog has an exceptional deep dive into ASan's mechanics. Understanding this is key to answering advanced interview questions.
Please read the section 'Building blocks of ASan', which covers 'Shadow memory' and 'Redzones'. Focus on: The relationship between application memory and shadow memory. The meaning of different shadow byte values (e.g., 00 for accessible, fd for freed memory, f1/f3 for redzones). How redzones are placed around variables to catch overflows.
Using ASan
To use ASan, you simply need to add a couple of flags to your GCC or Clang compile command:
gcc -g -fsanitize=address my_program.c -o my_program
Now let's see the wide array of bugs ASan can catch.
Address Sanitizer in C++ (A Tutorial)
This tutorial by arisaif provides a comprehensive tour of the types of errors ASan can detect. It's a great showcase of its power and versatility.
Watch the main demonstration section from 06:42 to 15:59. You don't need to follow every detail of the C++ code, but focus on the types of bugs being demonstrated and the resulting ASan error reports. Pay attention to how it catches: Heap-buffer-overflow Use-after-free Double-free Stack-buffer-overflow Global-buffer-overflow
As the video demonstrates, ASan gives rich, detailed error reports that are easy to understand.
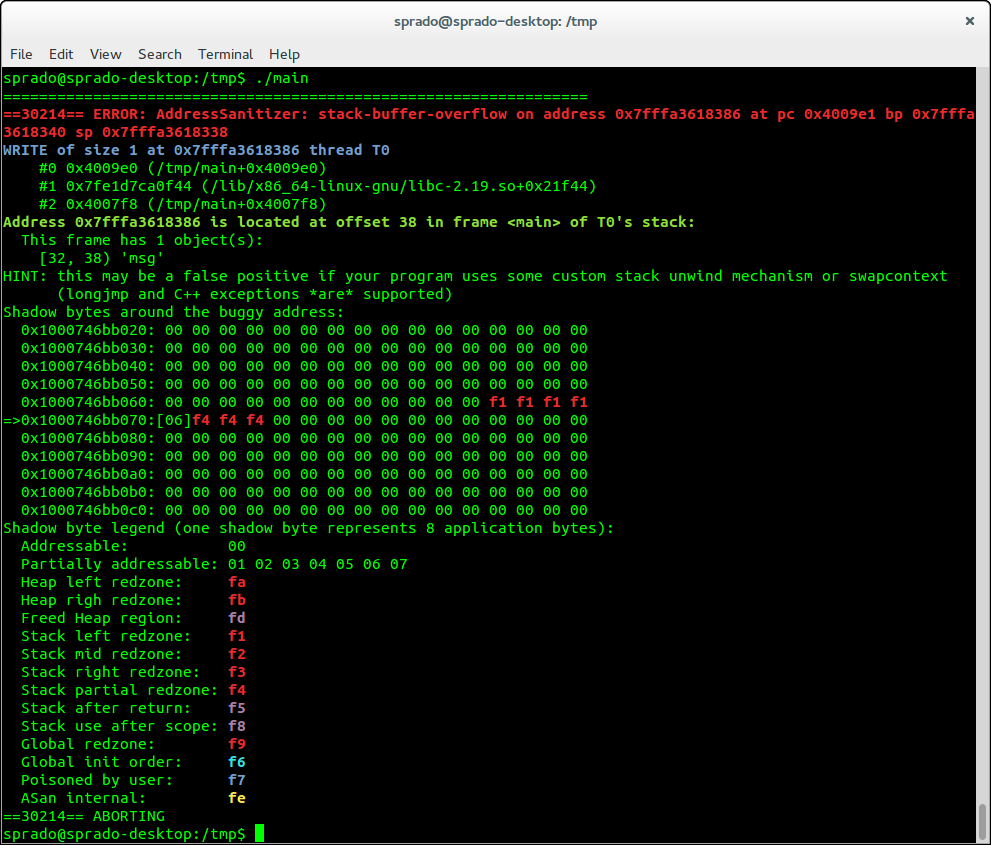
ASan Trade-offs
-
Pros:
- Low Performance Overhead: The slowdown is typically only 2-3x, making it feasible to keep ASan enabled during all testing and even for some internal deployments.
- High Accuracy: It detects a very wide range of errors, including stack and global overflows that Valgrind can miss.
- Fail-Fast: It aborts the program on the exact instruction that performs the invalid access, preventing further corruption.
-
Cons:
- Requires Recompilation: You must have the source code and rebuild your application and, ideally, its libraries with the ASan flag.
- Memory Overhead: The shadow memory mapping can significantly increase the program's memory usage.
4. Comparison and When to Use Which Tool
This is the critical system design question an interviewer will ask. Your ability to articulate the trade-offs demonstrates senior-level thinking.
Advanced Memory Debugging in C: A Deep Dive into Valgrind and ...
This article provides a fantastic summary comparing the two tools and their performance.
Please study the section 'Tool Comparison'. This table is a perfect summary for an interview answer.
Here is a summary of the key decision points:
| Scenario | Best Tool | Why? |
|---|---|---|
| During active development and in CI/CD pipelines | AddressSanitizer (ASan) | Low performance overhead allows it to be always-on during testing. It catches a wider variety of bugs with high precision. |
| Debugging a binary for which you have no source code | Valgrind | Valgrind is the only option, as it works on the compiled binary without needing to recompile. |
| Finding a subtle memory leak in a production binary | Valgrind | You can take the exact production binary that is misbehaving and run it under Valgrind to reproduce the issue. |
| Your system has very tight memory constraints | Valgrind | ASan's memory overhead can be prohibitive. While Valgrind is also memory-intensive, it might be a better fit in some constrained scenarios. |
| You need to profile cache performance or thread safety | Valgrind (Cachegrind/Helgrind) | Valgrind is a suite of tools. If your problem might be performance or threading-related, Valgrind offers integrated tools to investigate. |
Advanced Topic: What ASan Misses
For a top-tier company, knowing a tool's limitations is as important as knowing its strengths. The Trail of Bits article (LINK) you read earlier has a section on "ASan’s limitations and quirks". Key takeaways include:
- ASan doesn't poison padding bytes inside structs, so it can miss intra-object overflows.
- It won't detect bugs within custom memory allocators unless you manually "poison" the memory using annotations like
ASAN_POISON_MEMORY_REGION. This connects directly to our earlier lessons on custom allocators—you can integrate ASan into your own memory pool to detect misuse. - It may not detect an out-of-bounds array access if the resulting address happens to land in another valid, allocated memory region.
Mentioning these limitations in an interview shows a deep, practical understanding of the technology.
Conclusion
You now have a solid understanding of two of the most powerful memory debugging tools available for user-space C/C++ development. You can not only use them but also explain their underlying mechanisms and make informed decisions about which tool is right for a given situation.
Key Takeaways:
- Valgrind uses dynamic binary instrumentation, making it universal but slow (10-50x). It's best for analyzing existing binaries where recompilation isn't an option.
- AddressSanitizer (ASan) uses compile-time instrumentation and shadow memory, making it fast (2-3x slowdown) and comprehensive. It's the standard for modern development and CI workflows.
- The choice between them is a classic engineering trade-off between performance, convenience, and bug-detection scope.
- Knowing the limitations of a tool like ASan (e.g., handling of struct padding, custom allocators) is a key differentiator for a senior engineer.
Preview of the Next Lesson:
We've now covered debugging for both correctness (HardFaults, stack overflows) and memory safety (Valgrind, ASan). The final piece of the puzzle is performance. In our next lesson, we will learn how to answer the question, "Why is my system slow?" by using perf to conduct CPU and cache miss analysis, moving from finding bugs to finding bottlenecks.