Hello! Welcome to the final lesson of your "Embedded Interview Preparation Bootcamp."
In our last session, we mastered ftrace, diving deep into the Linux kernel to trace function execution and measure interrupt latencies. We learned how to answer the question, "What was the exact sequence of software events?"
Today, we move from the world of software tracing to hardware reality. We'll explore what happens when the bits leave the CPU and travel over the wires. Many of the toughest embedded systems bugs live at this hardware-software interface. A device not responding, corrupted data, or a bus that's completely silent—these are problems that printf and GDB often can't solve. To tackle them, you need a logic analyzer.
Your learning outcome for this lesson is to: Use a logic analyzer to debug I2C, SPI, or UART communication protocols by capturing and interpreting signal waveforms.
This is a critical, hands-on skill for any role at a semiconductor company, where you'll be expected to bring up new hardware, write and debug low-level drivers, and validate system functionality. We will cover the fundamental workflow: connecting the tool, capturing signals, and decoding them into meaningful data.
1. The Logic Analyzer: Your Window onto the Wires
A logic analyzer is a tool that captures and displays signals from a digital circuit. Unlike an oscilloscope, which shows the detailed analog characteristics of one or two signals, a logic analyzer specializes in capturing the logic state (high or low) of many digital signals at once.
To get a feel for the tool, let's start with a short video that introduces the modern, PC-based logic analyzer and the basics of connecting it to a device under test (DUT).
Instrument Basics: Logic Analyzer - Workbench Wednesdays
This video from element14 presents provides an excellent introduction to what a logic analyzer is, its typical form factor, and the crucial first step of making connections.
Watch from 00:12 to 02:29. Pay close attention to: The role of a logic analyzer in debugging digital buses like I2C and SPI. The 'flying lead' probes used to connect to your circuit. The absolute necessity of connecting the ground probe. This provides the reference voltage against which all signals are measured. How the analyzer converts analog voltages into digital 1s and 0s based on a voltage threshold.
Key Terminology
Before we proceed, let's solidify some key terms. The following reading provides clear definitions for the core concepts you'll encounter when using any logic analyzer.
How to Use a Logic Analyzer | Saleae Articles
This article from Saleae, a popular logic analyzer manufacturer, defines the essential terminology.
Read the "Terminology" section. Focus on understanding the definitions for Channel, Threshold, Sample Rate, Memory Depth, and Trigger.
2. Capturing Signals: The Core Workflow
Successfully capturing the data you need involves three main configuration steps: setting the sample rate, configuring the trigger, and finally, acquiring the data.
Sample Rate and Memory Depth
- Sample Rate: This determines how often the logic analyzer records the state of the input channels. A fundamental rule, derived from the Nyquist-Shannon sampling theorem, is that you must sample at least twice as fast as the highest frequency component of your signal to avoid aliasing. For digital signals, a common rule of thumb is to sample at least 4-10 times faster than the bus speed. For a 100 kHz I2C bus, a sample rate of 1 MHz (1 Msps) is a good starting point.
- Memory Depth: This is how many samples the analyzer can store. The total capture time is
Memory Depth / Sample Rate. A deeper memory allows you to capture longer events or use a higher sample rate for the same duration.
Triggering
The trigger tells the analyzer when to start recording data. Without a trigger, you'd be capturing continuous noise, hoping to find your event. A well-set trigger is the key to isolating specific bus transactions. Common trigger types include:
- Edge Trigger: Start capturing on a rising or falling edge of a specific channel. This is perfect for the
STARTcondition of I2C or the chip select of SPI. - Pattern Trigger: Start capturing when a specific pattern of high/low states appears across multiple channels.
The following video demonstrates these settings in a typical logic analyzer application.
Instrument Basics: Logic Analyzer - Workbench Wednesdays
Let's see how sample rate, memory depth, and triggers are configured in practice.
Watch from 02:29 to 05:25. Observe: How the sample rate and memory depth are selected. The effect of changing the sample rate on the capture duration and detail. How a simple trigger condition is configured.
3. Debugging I2C Communication
With your background in automotive systems, you've likely worked with I2C extensively. Now, let's look at it from the physical layer. An interview question like, "An I2C peripheral isn't responding. How would you debug it?" is very common. The logic analyzer is your primary tool.
I2C Protocol Recap
Let's quickly review the I2C transaction structure.

A typical I2C transaction involves:
- Start Condition: Master pulls SDA low while SCL is high.
- Address Frame: 7-bit slave address followed by a Read/Write bit.
- ACK/NACK: The slave pulls SDA low to acknowledge its address. If it doesn't, this is a NACK, and it's a key symptom to look for.
- Data Frame(s): 8-bit data packets, each followed by an ACK/NACK.
- Stop Condition: Master pulls SDA high while SCL is high.
Debugging Walkthrough: Reading a Temperature Sensor
The following guide from Analog Devices provides a perfect, step-by-step example of capturing and analyzing an I2C transaction. It details the hardware connections, software configuration, and interpretation of the results.
Debugging I2C with the ADALM2000
This article provides a complete walkthrough of debugging an I2C bus connected to a temperature sensor. It's a model workflow for any I2C debugging task.
Read the entire article, paying close attention to these four sections: Background: A concise review of I2C protocol components. Hardware Configuration: Note the simple connections: SCL, SDA, and GND. Scopy Logic Analyzer Configuration: This is the core workflow. See how they group channels, apply the I2C decoder, and set a trigger on the start condition (falling edge of SDA). I2C Transfer Example: This is the most important part. Study the screenshots and analysis for both a 'Read ID Register' and a 'Read Temperature' command. Understand how the decoded output directly maps to the protocol sequence (Address, R/W, Data, ACK/NACK).
The key to "interpreting the waveform" is using the protocol decoder. As shown in the article, this software feature overlays the raw digital waveforms with high-level interpretations like Start, Address, ACK, and the hexadecimal values of data bytes. Without it, you would be manually counting clock pulses and reading bit values, which is extremely tedious and error-prone.
4. Debugging SPI Communication
SPI is another ubiquitous protocol, favored for its higher speed and simpler hardware implementation compared to I2C. A classic interview scenario involves verifying communication with an external flash memory device.
SPI Protocol Recap
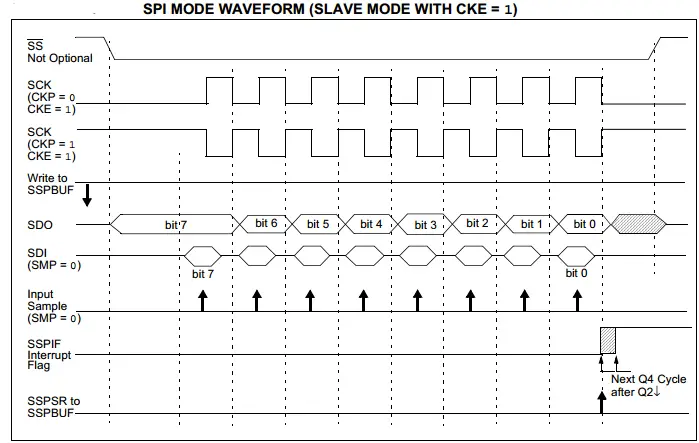
- Signals: SCLK (Clock), CS/SS (Chip/Slave Select), MOSI (Master Out, Slave In), MISO (Master In, Slave Out).
- Operation: The master selects a single slave by asserting its CS line (usually active low). Communication is full-duplex over the MOSI and MISO lines, synchronized by the SCLK provided by the master.
Debugging Walkthrough: Sniffing SPI Flash
This next video demonstrates a fantastic real-world example: reverse-engineering a router by sniffing the SPI bus between the main processor and the boot flash.
Extracting Firmware from Embedded Devices (SPI NOR Flash) ⚡
This video from Flashback Team shows how to connect a logic analyzer to an SPI flash chip and interpret the boot-up communication by cross-referencing with the device's datasheet.
Watch the following segments: SPI Protocol Basics (06:15 - 07:41): A quick refresher on the four SPI signals. Capturing SPI Data (09:43 - 11:23): See how the probes are connected and how the raw waveform data is captured during the device boot-up. Decoding with Datasheet (11:23 - 13:37): This is the crucial part. Observe how they apply the SPI analyzer and then use the flash chip's datasheet to understand what the captured bytes (0x03 = READ command) actually mean. Active Probing (16:15 - 17:44): This shows a more advanced technique, using a tool to send commands and observing the results on the logic analyzer, confirming their understanding.
The key takeaway here is the synergy between the logic analyzer and the component datasheet. The analyzer shows you what was sent, but the datasheet tells you why it was sent and what it means. When debugging, you're constantly comparing the captured trace against the expected timing diagrams and command sequences in the datasheet.
5. A Note on Debugging UART
Debugging UART follows the same principles, with one key difference.
- Protocol: Asynchronous, meaning no clock line. Timing is inferred from a pre-agreed baud rate. It uses a Start bit (logic low), 5-9 data bits, an optional parity bit, and 1-2 Stop bits (logic high).
- Capture & Decode: You connect a probe to the TX or RX line and trigger on the falling edge of the Start bit. When you apply the UART protocol decoder, you must configure it with the correct baud rate, number of data bits, parity, and stop bits. If your settings don't match the transmitter's, the decoder will output garbage. This is the most common cause of failure when analyzing UART signals.
Conclusion: Completing Your Bootcamp
Congratulations on completing the final lesson of the Embedded Interview Preparation Bootcamp! Today, you've learned to use a logic analyzer, a powerful tool that bridges the gap between the software you write and the hardware it runs on.
Key Takeaways from this Lesson:
- A logic analyzer captures multiple digital signals and displays them as timing waveforms.
- The core workflow is: Connect (probes and ground) -> Configure (sample rate, logic threshold, trigger) -> Capture -> Analyze (using protocol decoders).
- For I2C, you look for start/stop conditions, correct slave addresses, and the presence of ACK/NACK signals.
- For SPI, you trigger on chip select and use the component's datasheet to interpret command and data bytes on MOSI/MISO.
- For UART, configuring the decoder with the correct baud rate and frame format is essential for a successful interpretation.
Over the course of this bootcamp, you have systematically built upon your existing experience, diving deep into the topics that differentiate a senior engineer in interviews at top semiconductor and systems companies. You've gone from advanced C memory manipulation and aliasing rules, through the intricacies of the build process, to the core of computer architecture. You have implemented complex embedded data structures, explored modern C++, demystified RTOS scheduling and synchronization, and navigated the Linux kernel's memory and driver models. Finally, you've armed yourself with a professional suite of debugging tools, from GDB and Valgrind to perf, ftrace, and now, the logic analyzer.
You have the knowledge and the framework to tackle complex system design questions and deep technical challenges. The next step is practice—apply these concepts to personal projects, review the material, and walk into your interviews with the confidence that you are prepared not just to answer questions, but to demonstrate true system-level expertise. Good luck