Hello! This is the final lesson in your "Embedded Interview Preparation Bootcamp."
In our last session, we mastered the logic analyzer, your window into the world of digital protocols. We learned how to capture and decode I2C, SPI, and UART communications to answer the question, "Are the right bits being sent at the right time?"
Today, we address a related but distinct and equally critical question: "How much power does this operation cost?" As embedded systems, especially in the IoT and mobile spaces, become increasingly battery-dependent, power consumption is no longer an afterthought—it is a primary design constraint. Understanding how to measure and analyze it is a non-negotiable skill for roles at top semiconductor companies, as it impacts everything from battery life estimation to thermal design and even system security.
Your learning outcome for this lesson is to: Analyze a system's power consumption profile using an oscilloscope or dedicated power analyzer to identify high-draw events.
We'll explore why this is harder than it looks, cover the professional tools and techniques used to get accurate measurements, and, most importantly, learn how to correlate power consumption directly back to the code you write.
1. The Challenge of Measuring Dynamic Current
At first glance, measuring current seems simple: put a multimeter in series with your device's power supply. However, for modern embedded systems that rapidly switch between deep sleep (drawing nanoamps or microamps) and active states (drawing hundreds of milliamps), this approach often fails spectacularly.
The following video explains the core problem—burden voltage—and why standard multimeters are unsuitable for profiling the power consumption of a device like an ESP32.
#386 How to measure low Currents for ESP/Arduino? Power Profiler, Otii, µCurrent Gold, Joulescope
This video by Andreas Spiess provides an excellent, practical demonstration of why measuring dynamic current is tricky and introduces the concept of burden voltage.
Watch from 01:45 to 05:36 and the summary from 16:06 to 17:18. Focus on: The experiment showing an ESP32 crashing due to a brownout when a multimeter is used. The explanation of burden voltage: the voltage drop across the multimeter's internal shunt resistor. Why different current ranges on a multimeter have different internal resistors, and how this affects the measurement. The key requirements for a proper measurement tool: low burden voltage and wide, automatic range switching.
As you saw, the voltage drop caused by the measurement tool itself can starve your device of power during high-current peaks, leading to resets or brownouts. This makes the measurement not only inaccurate but also disruptive.
2. Core Measurement Techniques
To overcome these challenges, engineers use two primary methods.
Technique 1: Shunt Resistor and Oscilloscope
The classic approach is to insert a small, precision resistor (a shunt resistor) in the power or ground path of the device under test (DUT) and measure the voltage drop across it with an oscilloscope.

This method is based on Ohm's law. If you use a 1Ω resistor and measure a 10mV drop, you know the device is drawing 10mA.
The following application note from Texas Instruments details the theory behind this technique and the calculations for determining average current and battery life.
AN057: Measuring Power Consumption
This document provides the theoretical foundation for power measurement with a shunt resistor.
Read the sections "4.1 Instrumentation" and "4.2 Calculation of the average current consumption". You don't need to read the entire document, but focus on: The basic measurement setup diagram. The formula UTARGET BOARD = UPOWER SUPPLY - RI and its implication: a larger shunt resistor R or current I creates a larger voltage drop, which can affect the DUT. The formulas for calculating average current and battery lifetime. These are common interview topics.
Pros:
- Inexpensive and uses common lab equipment.
Cons:
- You must choose the shunt resistor value carefully as a trade-off: a larger value gives you a bigger voltage signal (easier to measure) but also a larger burden voltage.
- The oscilloscope has a limited vertical resolution, making it difficult to measure very low sleep currents and very high active currents simultaneously.
- Requires manual calculations to convert voltage to current and to find average power.
Technique 2: Dedicated Power Analyzers and Source Measurement Units (SMUs)
The modern, professional solution is to use a dedicated power analyzer, often called a Source Measurement Unit (SMU). These tools are specifically designed to solve the problems of dynamic current measurement.
This next video compares various measurement methods and highlights the capabilities of a USB-based SMU.
How to Profile Battery Usage for IoT Devices - Workbench Wednesdays
This video from element14 presents provides a great comparative overview of different tools and demonstrates the power of a dedicated SMU.
Watch from 01:10 to 06:18, and the summary from 07:15 to 07:57. Pay attention to: How the DMM misses the high-current transients. How the oscilloscope with a current probe can see the spikes but is too noisy for low-current sleep states. How the dedicated SMU (in this case, the Nordic Power Profiler Kit) provides the best of both worlds: high dynamic range, low noise, and integrated software.
These tools work by using a set of internal shunt resistors and a fast-switching amplifier. They automatically switch to the appropriate resistor for the current being drawn, ensuring a minimal burden voltage across a huge dynamic range (e.g., from <1µA to 1A).
3. Correlating Power Consumption to Code Execution
Measuring the power profile is only half the battle. To optimize power, you must identify which part of your code is responsible for high-draw events. This is where you connect the hardware measurement back to the software.
The most effective technique is to use GPIOs as event markers.
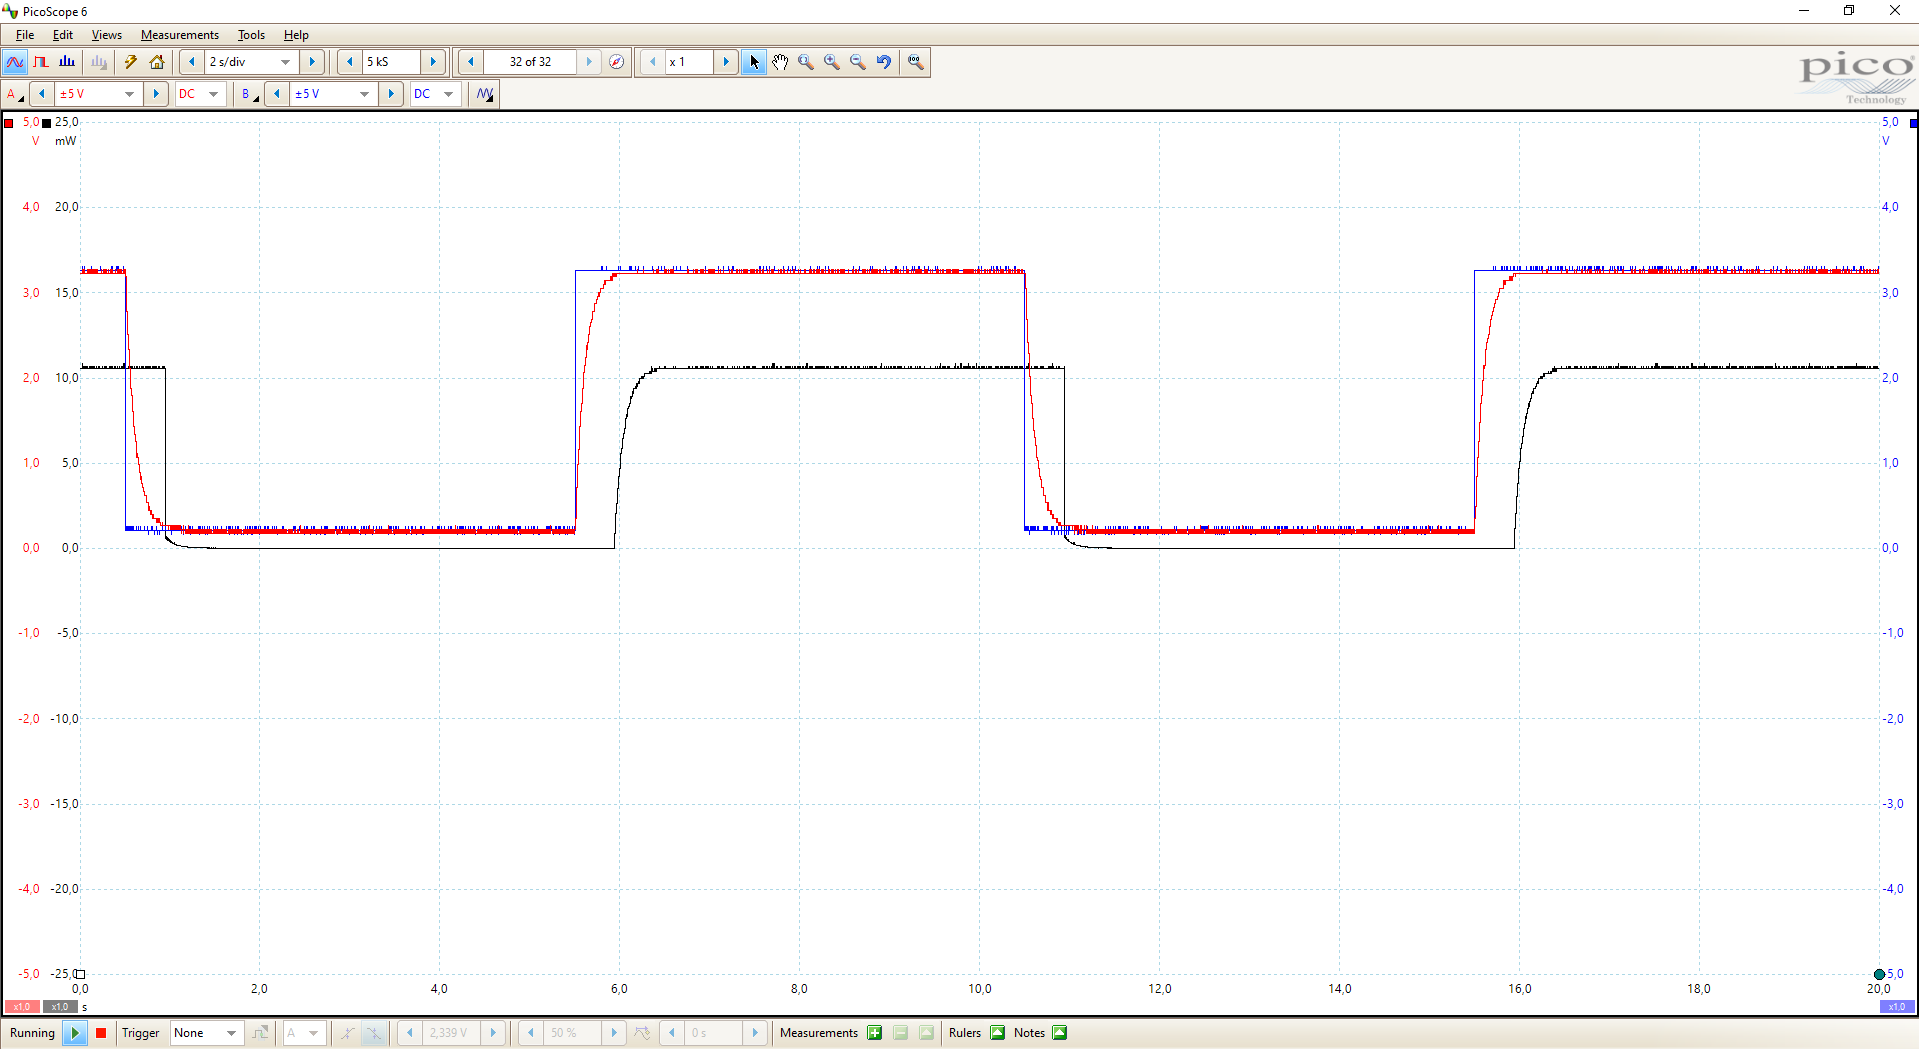
The workflow is straightforward:
-
Instrument your code: Before and after a block of code you want to profile, toggle a GPIO pin.
// Set a pin high before the operation gpio_set(PROFILING_PIN_1); // The operation you want to measure sd_card_write(data, length); // Set the pin low after the operation gpio_clear(PROFILING_PIN_1); -
Connect the analyzer: Connect the power analyzer to your DUT's power supply. Connect a digital channel of the analyzer to the GPIO pin you are toggling.
-
Capture and Analyze: The analyzer's software will display the power waveform and the digital marker signal on the same timeline. You can now place cursors around the time the GPIO was high and have the software calculate the average current, peak current, and total charge consumed by precisely that block of code.
Both videos you watched demonstrate this technique effectively. The element14 video used it to discover that writing to the SD card was by far the most power-hungry operation.
4. Advanced Application: Simple Power Analysis (SPA)
Analyzing a power profile isn't just for battery life optimization. It's also a fundamental technique in hardware security known as side-channel analysis. The principle is that different CPU operations consume different amounts of power. A complex multiplication or a cryptographic hash function will have a different power "signature" than a simple conditional branch.
By observing a device's power consumption, an attacker might be able to infer secret information. For an interview at a company that builds secure SoCs, understanding this concept is a significant advantage.
A Framework to Evaluate Embedded Security Implementations
This research paper demonstrates using Simple Power Analysis (SPA) to differentiate between firmware implementations on an SSD by analyzing their power signatures during an unlock command.
Read Section 4.3 ("Power Analysis") and Section 7.1 ("Power Analysis"). Focus on the figures and their descriptions: Figure 20: Notice the clear difference in the time-domain power trace (the "plateau") between a simple if statement and a complex PBKDF2 key derivation function. Figures 23, 24, 25: Observe how different ATA Unlock implementations (string compare vs. SHA256 vs. PBKDF2) on commercial SSDs produce distinctly different power signatures. The SHA256 and PBKDF2 operations are clearly identifiable "high-draw events." This shows how the skill you're learning—identifying high-draw events—is directly applicable to security analysis.
Conclusion: Completing Your Bootcamp
Congratulations! You have reached the end of the Embedded Interview Preparation Bootcamp. Today, you've learned a crucial skill for any senior embedded engineer: how to professionally measure and analyze a system's power consumption.
Key Takeaways from this Lesson:
- Standard multimeters are inadequate for profiling dynamic current due to burden voltage and slow sampling.
- Two primary techniques exist: using a shunt resistor with an oscilloscope for basic analysis, and using a dedicated power analyzer (SMU) for accurate, high-dynamic-range measurements.
- The key to actionable analysis is to correlate power events to code by instrumenting your software with GPIO markers.
- Power profile analysis is a versatile skill, critical for battery life optimization, thermal management, and even hardware security analysis (SPA).
Over the course of this bootcamp, we have journeyed from the nuances of C pointers and the build process, through the depths of computer architecture, RTOS scheduling, and Linux kernel drivers, to the practical art of advanced debugging. You have systematically built on your experience to master the topics that truly set apart top candidates at leading semiconductor and systems companies.
You now possess a robust framework for tackling deep technical questions and complex system design challenges. The next step is to continue practicing and internalizing these concepts. Apply them to personal projects, review the materials, and walk into your interviews with the confidence that you are prepared not just to answer questions, but to demonstrate true system-level expertise.
Best of luck in your interviews. You are well-prepared.