Hello! Welcome to your next lesson in the Embedded Interview Preparation Bootcamp.
In our last session, we focused on cross-compilation and the art of commanding the compiler with target-specific flags to generate highly optimized machine code. This is a powerful skill, but it comes with a major caveat: aggressive compiler optimizations can expose, or even create, subtle bugs if our source code isn't perfectly sound. What if an optimization removes a safety check you wrote because it assumes a certain error condition is "impossible"?
This is where static analysis comes in. Today, we'll explore the tools and techniques used to automatically inspect our source code for bugs, undefined behavior, and common pitfalls before we even compile and run it. Think of it as an automated expert code reviewer that helps us build more robust and reliable systems.
Your learning goal for this lesson is to: Use static analysis tools (e.g., cppcheck, clang-tidy) to detect undefined behavior and common C pitfalls.
We will cover:
- The profound danger of Undefined Behavior (UB) and why it's a primary target for static analysis.
- A practical guide to using
cppcheck, a popular open-source tool, to find real bugs. - How to interpret results, manage false positives, and integrate static analysis into your build process.
The Treachery of Undefined Behavior
Before we dive into the tools, we must understand why they are so critical. The single most important concept here is Undefined Behavior (UB). In C, UB does not mean "your program will crash." It means the C standard places no requirements whatsoever on the compiler's or the program's behavior.
When the compiler encounters code that could trigger UB, it is allowed to assume that the UB path will never be taken. This assumption is a license to perform aggressive optimizations that can lead to baffling, non-intuitive bugs.
To see just how strange this can get, let's watch a segment from a talk that explores how compilers exploit UB.
Advanced C: The UB and optimizations that trick good programmers.
The video 'Advanced C: The UB and optimizations that trick good programmers' by Eskil Steenberg provides a fantastic deep dive into this topic. We'll start with an example showing how compilers can remove code based on assumptions about UB.
Watch from 19:35 to 27:35. Pay close attention to the examples involving signed integer overflow and array out-of-bounds access. The key takeaway is how the compiler can optimize away an if statement because it assumes the condition leading to it (which is UB) is unreachable.
As the video demonstrated, if you write a check like if (x + 1 < x) to detect signed integer overflow, the compiler is permitted to assume overflow never happens and can simply remove your check entirely. The bug isn't just that the overflow happens; it's that your attempt to guard against it vanishes.
This can lead to so-called "time travel" bugs, where an issue seems to manifest before the line of code that causes it. Let's look at another clip from the same video that illustrates this.
Advanced C: The UB and optimizations that trick good programmers.
Now let's look at a truly mind-bending example where a null pointer dereference causes a check earlier in the code to be optimized away.
Watch from 37:58 to 41:10. This section on 'time travel' bugs is a critical concept for interviews. It demonstrates that you cannot always reason about a program's behavior by simply reading the code sequentially if UB is present.
The key insight is that once UB is invoked, the program's behavior is no longer predictable from the source code alone. This is why static analysis tools are so vital—they help us find these latent time bombs.
Let's ground this with a real-world example from a developer who was bitten by a subtle UB bug in production.
The production bug that made me care about undefined behavior
The article 'The production bug that made me care about undefined behavior' by Gaultier provides a compelling story about a bug caused by an uninitialized struct in C++. The principles apply directly to C.
Read the sections 'Just enough rope to hang yourself', 'Static analysis to the rescue?', and the 'Conclusion'. Focus on how a seemingly innocuous line Response response; led to an impossible state, and how static analysis tools were evaluated to catch this class of error.
Static Analysis to the Rescue
As the article highlighted, compilers often fail to warn about these issues, even with all warnings enabled. This is where dedicated static analysis tools shine. They are designed specifically to hunt for UB and other dangerous patterns.

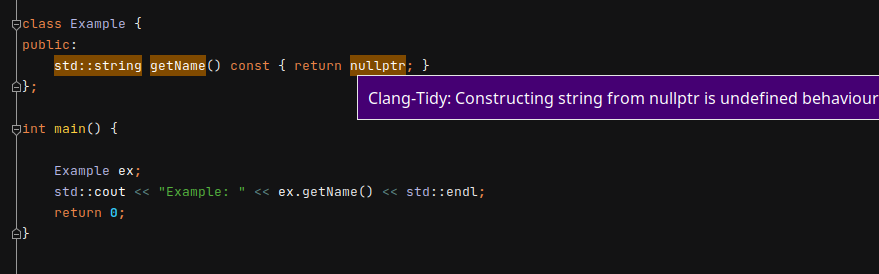
Let's get practical and learn how to use one of the most common open-source tools, cppcheck.
A Practical Guide to cppcheck
cppcheck is a versatile and widely-used static analysis tool for C/C++. It's particularly well-suited for embedded systems because it's designed to handle non-standard compiler extensions often found in low-level code.
The following video provides a concise, step-by-step guide to getting started. We'll walk through it together.
Static Analysis for C/C+ with cppcheck (+Makefile) | Embedded System Project Series #9
This tutorial, 'Static Analysis for C/C++ with cppcheck' from the Artful Bytes channel, will be our guide for this section. We will cover installation, basic usage, configuration, and integration into a Makefile.
Watch the entire video (around 4 minutes). We will break down each step below, so you can follow along with your own code examples.
1. Installation and Basic Usage
First, install cppcheck. On a Debian/Ubuntu system, this is straightforward:
sudo apt install cppcheck
Now, let's create a C file named test.c with a blatant bug:
// test.c
int main() {
    char a[10];
    a[10] = 0; // Out-of-bounds access
    return 0;
}
Running cppcheck on this file immediately finds the error:
$ cppcheck test.c
Checking test.c...
[test.c:4]: (error) Array 'a[10]' index 10 out of bounds
2. Enabling More Checks and Interpreting Output
By default, cppcheck focuses on high-confidence errors. To get a more thorough analysis, you can enable more checks. The --enable=all flag is a great starting point.
Modify test.c:
// test.c


#include <stdio.h>

void unused_function() {
    printf("I am never called.\n");
}

int main() {
    char a[10];
    a[9] = 0; // Fix the previous bug
    return 0;
}
Now run it with more checks enabled:
$ cppcheck --enable=all test.c
Checking test.c...
[test.c:4]: (style) The function 'unused_function' is never used.
Notice the severity level is now (style). Understanding these levels is key to triaging the results.
The cppcheck manual officially defines these severity levels. Let's quickly review them.
Read the short section on 'Severities' to understand the difference between error, warning, style, performance, and portability.
- Error: Definitely a bug or UB. Highest priority.
- Warning: Might be a bug. Needs investigation.
- Style: Not a bug, but could be improved (e.g., unused functions, redundant code).
3. Suppressing Unwanted Warnings
Sometimes, a tool will report a "false positive" or a warning on code that is intentionally written a certain way. Being able to selectively suppress these warnings is crucial for keeping the analysis output clean and useful.
You can do this directly in the code with a special comment:
// test.c

// cppcheck-suppress unusedFunction
void intentionally_unused_function() {
    // This is for a feature that is not yet enabled.
}

int main() {
    return 0;
}
To make this work, you must tell cppcheck to look for these comments:
$ cppcheck --enable=all --inline-suppr test.c
Checking test.c...
No output is generated, as the warning was suppressed. For managing suppressions across a large project, using a dedicated suppression file is often a better approach.
The cppcheck manual details several ways to manage suppressions. It's worth knowing the options.
Skim the 'Suppressions' section. Pay attention to the syntax for 'Inline suppressions' and 'Suppressions in a file'. You don't need to memorize it, just know it exists.
4. Integrating into a Build System
Manually running cppcheck is fine for a single file, but for a real project, you'll want to automate it. The best way is to add a target to your Makefile.
Here's an example Makefile snippet, similar to the one in the video:
CFLAGS = -Wall -Wextra -g
SRCS = main.c module1.c
OBJS = $(SRCS:.c=.o)
TARGET = my_app

.PHONY: all clean cppcheck

all: $(TARGET)

$(TARGET): $(OBJS)
	$(CC) $(CFLAGS) -o $@ $^


# --- Static Analysis Target ---
cppcheck:
	@echo "Running Cppcheck..."
	cppcheck --enable=all --inline-suppr --error-exitcode=1 $(SRCS)

clean:
	rm -f $(OBJS) $(TARGET)
Now, you can simply run make cppcheck to analyze all source files in your project. The --error-exitcode=1 flag is useful for continuous integration (CI) systems, as it will cause the build step to fail if any errors are found.
5. Addons for Specialized Checks
cppcheck also has an addon system. For your automotive background, the MISRA addon is particularly relevant. MISRA C is a coding standard developed to ensure the safety and reliability of software in critical systems.
Let's briefly look at the addon section in the manual.
Read the introductory part of the 'Addons' section, specifically noting the misra.py addon.
Using this addon (cppcheck --addon=misra.json ...) allows you to check your code for compliance against MISRA C rules, a common requirement in the automotive industry.
Conclusion
You've now seen that writing "correct" C code is more than just getting it to compile without warnings. Undefined Behavior creates a dangerous separation between what the code says and what the program does. Static analysis is our primary defense against this.
Key Takeaways:
- Undefined Behavior (UB) allows compilers to make optimizations that can break your code in non-obvious ways, even removing safety checks.
- Static analysis is an automated code review process that finds bugs, UB, and dangerous patterns before runtime.
cppcheckis a powerful, configurable tool that can be easily integrated into a build workflow using aMakefile.- Effectively using a static analyzer involves enabling the right checks (
--enable=all), understanding severity levels (error,warning), and managing false positives through suppressions.
Preview of the Next Lesson:
We've covered how to generate optimized code and how to verify that code statically. But what happens when we need to debug the running program? The link between your source code and the machine code is a set of debugging symbols. In the next lesson, we will inspect DWARF debugging symbols using readelf or dwarfdump to understand how source-level debugging is enabled. This will complete our journey through the build process, from source to executable to debuggable artifact.