Hello! Welcome to the final lesson of our module on the C build process.
In our last session, we delved into static analysis, using tools like cppcheck to proactively find undefined behavior and other pitfalls in our source code. This helps ensure our code is robust before we hand it off to the compiler.
So far in this module, we've traced a C file through preprocessing, compilation, optimization, and linking. But what happens when we need to debug the final product? When you set a breakpoint on a line of C code in GDB, how does the debugger know which of the millions of machine instructions corresponds to that line? The magic lies in the debugging symbols.
Today, we will pull back the curtain on this process. We'll explore how the compiler embeds a "map" between your source code and the binary, and how we can inspect this map ourselves.
Your learning goal for this lesson is to: Inspect DWARF debugging symbols using readelf or dwarfdump to understand how source-level debugging is enabled.
We will cover:
- The role of the
-gcompiler flag and the DWARF standard. - How to use
readelfto find the debug sections within an ELF binary. - Using
dwarfdumpandaddr2lineto interpret DWARF data and map addresses back to source code. - The impact of debug information on binary size and modern solutions like split DWARF and debug info servers.
The Foundation: Generating Debug Information
As you know, the -g flag is the key to creating a debuggable binary. But what does it actually do? It instructs the compiler to generate a rich set of metadata that describes your program—functions, variables, types, and the layout of your source files—and embed this information into the output object file.
This extra data doesn't alter the executable code itself, so it generally doesn't affect runtime performance. However, it does increase the file size on disk. The most common format for this information on Linux and many embedded systems is DWARF (Debugging With Attributed Record Formats).
Let's watch a short segment that introduces this concept.
Linux Debuginfo Formats - DWARF, ELF, dwo, dwp - What are They All? - Greg Law - CppCon 2022
The talk 'Linux Debuginfo Formats' by Greg Law at CppCon 2022 provides an excellent overview. We'll start with the basics of what -g does and where the debug info lives.
Watch from 02:27 to 08:23. Pay close attention to two key points: The explanation of what the -g flag does. The diagram showing that debug info is part of the file on disk but is not mapped into the process's memory space at runtime.
As the video highlights, the debug information lives in the executable file but stays on disk when you run the program. This is a crucial point for interviews: enabling debug info increases binary size but does not consume RAM or slow down the execution of the program itself.
Finding the DWARF: ELF Debug Sections
On most systems you'll work with, from Linux servers to embedded ARM SoCs, executables use the ELF (Executable and Linkable Format). This format organizes the file into various "sections." Code goes in the .text section, initialized global variables in .data, and so on.
When you compile with -g, the compiler adds several new sections, all typically prefixed with .debug_. These sections contain the DWARF data.
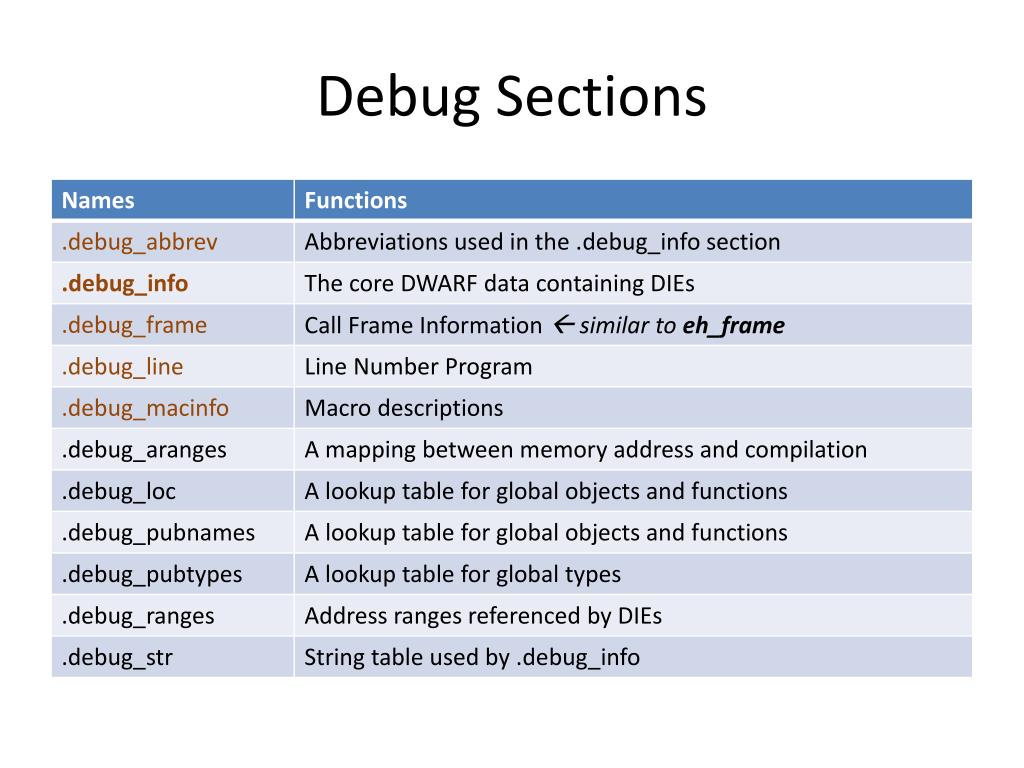
We can see these sections for ourselves using the readelf utility, a standard tool for inspecting ELF files.
Let's create a simple C file, debug_test.c:
// debug_test.c


#include <stdio.h>

static int add(int x, int y) {
    return x + y;
}

int main() {
    int result = add(5, 10);
    printf("Result: %d\n", result);
    return 0;
}
First, compile it without debug symbols and list the sections:
$ gcc -o debug_test_nostrip debug_test.c
$ readelf -S debug_test_nostrip | grep .debug


# (No output is expected)
Now, compile it with debug symbols (-g) and check again:
$ gcc -g -o debug_test_g debug_test.c
$ readelf -S debug_test_g | grep .debug
  [27] .debug_aranges    PROGBITS        ...
  [28] .debug_info       PROGBITS        ...
  [29] .debug_abbrev     PROGBITS        ...
  [30] .debug_line       PROGBITS        ...
  [31] .debug_str        PROGBITS        ...
  [32] .debug_line_str   PROGBITS        ...
As you can see, a whole family of .debug_* sections has appeared. This is where the DWARF data lives.
Peeking Inside: Interpreting DWARF Data
Now that we know where to find the DWARF information, how do we read it? The raw data is binary, but tools like dwarfdump, objdump -g, and readelf --debug-dump can parse it into a human-readable format.
DWARF represents program information as a tree of Debugging Information Entries (DIEs).
- Each DIE has a Tag (
DW_TAG_*) that defines what it is (e.g., a function, a variable, a type). - Each DIE has Attributes (
DW_AT_*) that describe it (e.g., name, source file, line number, memory address).
Let's examine the structure with a practical resource.
The Dwarves Beneath the Kernel: Forging BTF for eBPF
The article 'The Dwarves Beneath the Kernel' from Bootlin provides a fantastic, concise explanation of DWARF structure using a real-world kernel example. It perfectly illustrates the tag/attribute system.
Read the entire section 'The debug sections and the DWARF format'. Focus on the objdump -g output. See how it shows a DW_TAG_subprogram for a function, with attributes like DW_AT_name, and DW_TAG_formal_parameter for its arguments.
Practical Inspection with dwarfdump and addr2line
Let's apply this knowledge to our debug_test_g binary.
1. Inspecting a Function's DIE
We can use dwarfdump to find the DIE for our main function.
# The exact command might be `dwarfdump` or `llvm-dwarfdump`
$ dwarfdump --name=main debug_test_g
The output will be verbose, but you will find an entry like this (abbreviated for clarity):
0x0000008e: DW_TAG_subprogram
              DW_AT_external    (true)
              DW_AT_name        ("main")
              DW_AT_decl_file   (".../debug_test.c")
              DW_AT_decl_line   (8)
              DW_AT_low_pc      (0x1149)
              DW_AT_high_pc     (0x1173)
              ...
This tells us everything a debugger needs:
- It's a function (
DW_TAG_subprogram). - Its name is "main" (
DW_AT_name). - It's declared in
debug_test.con line 8 (DW_AT_decl_*). - Its machine code resides from address
0x1149up to (but not including)0x1173(DW_AT_low_pc,DW_AT_high_pc).
2. Mapping Address to Line with addr2line
The .debug_line section contains a highly optimized mapping of program addresses to source lines. The addr2line utility provides a simple interface to this map.
First, let's find an address inside main. We can use objdump:
$ objdump -d debug_test_g | grep -A 5 '<main>:'
0000000000001149 <main>:
    1149:	f3 0f 1e fa          	endbr64
    114d:	55                   	push   %rbp
    114e:	48 89 e5             	mov    %rsp,%rbp
    1151:	48 83 ec 10          	sub    $0x10,%rsp
    1155:	ba 0a 00 00 00       	mov    $0xa,%edx   <-- Let's use address 0x1155
Now, use addr2line to translate 0x1155 back to its source location:
$ addr2line -e debug_test_g 0x1155
.../debug_test.c:9
It correctly identifies line 9: int result = add(5, 10);. This is the core mechanism that enables step-by-step debugging at the source level.
For a deeper dive into how addr2line works, including some of the complexities involved, let's return to Greg Law's talk.
Linux Debuginfo Formats - DWARF, ELF, dwo, dwp - What are They All? - Greg Law - CppCon 2022
This segment demonstrates using addr2line in a more complex scenario, highlighting how you need to calculate offsets relative to where sections are mapped in memory. This is the kind of deep detail that interviewers at top tech companies look for.
Watch from 29:15 to 33:31. Don't worry about memorizing the exact calculations. The key is to understand that mapping a runtime program counter back to a static file offset is a non-trivial task that relies on parsing ELF and DWARF data.
The Cost of Debugging: Size and Modern Solutions
As we've established, debug info is "free" at runtime but not on disk. For large projects, the debug information can be many times larger than the executable code itself. This can be a problem for storage on embedded devices or for distribution.
Linux Debuginfo Formats - DWARF, ELF, dwo, dwp - What are They All? - Greg Law - CppCon 2022
Let's quantify this size increase with a real-world example from the same presentation.
Watch from 33:31 to 38:15. Notice how the size of the gzip binary balloons when compiled with different -g levels.
This leads to a classic dilemma: ship small binaries without debug info, making field crash analysis nearly impossible, or ship huge binaries? Fortunately, modern toolchains provide better options.
-
Strip and Store: The traditional method is to
stripthe debug information from the binary you ship, but keep a copy of the unstripped binary on a server. When a crash dump comes in, you use the unstripped version to analyze it. This requires careful version management. -
Split DWARF (
-gsplit-dwarf): A more advanced GCC/Clang feature. The bulk of the DWARF info is put into separate.dwofiles. The main executable contains only a link to these files. This keeps the executable small and speeds up link times, as the linker doesn't have to process gigabytes of DWARF data. The debugger can find and load the.dwofiles when needed. -
Debug Info Servers (
debuginfo-d): This is the enterprise-grade solution used by companies like Google, Meta, and Red Hat. All debug information (and source code) is placed on a central HTTP server. Binaries are identified by a unique "build ID". When GDB loads a binary, it reads the build ID, queries the server, and downloads the correct debug info on-demand. This completely decouples the executable from its debug data.
Let's see a quick demo of these last two concepts.
Linux Debuginfo Formats - DWARF, ELF, dwo, dwp - What are They All? - Greg Law - CppCon 2022
We'll conclude with two final clips covering split DWARF and debuginfo-d. Understanding these advanced workflows demonstrates a grasp of modern, large-scale software engineering practices.
Watch from 40:27 to 45:15 to learn about split DWARF. Then, watch from 49:45 to 57:42 for an excellent demonstration of a debug info server. This shows how a stripped binary can be magically debugged with full symbols.
Conclusion
You have now completed the journey from C source code to a final, debuggable executable. You understand not only the compilation stages but also the critical metadata that bridges the gap between the human-readable source and the machine's binary world.
Key Takeaways:
- Source-level debugging is enabled by metadata, typically in the DWARF format, which is generated by the compiler when using the
-gflag. - This metadata is stored in dedicated
.debug_*sections within an ELF executable file and is not loaded into memory at runtime. - Utilities like
readelfallow you to see the ELF sections, whiledwarfdumpandobjdumplet you inspect the human-readable DWARF tree of tags and attributes. addr2lineis a powerful utility that uses the DWARF line number table to map a machine code address directly back to a source file and line.- The significant size of debug information presents a practical challenge, addressed by modern solutions like split DWARF and debug info servers.
Preview of the Next Module:
This lesson concludes Module 3, "The Build Process and Program Execution." We are now moving from the software toolchain to the hardware it runs on.
Our next module, "CPU and System Architecture," is a critical differentiator for interviews at semiconductor companies. We will begin with the lesson: "Explain the L1/L2/L3 cache hierarchy, including cache lines, sets, ways, and associativity." This will be our first step into understanding the hardware that makes our software perform.