Welcome back. In our previous lesson, you mastered event listeners, learning how to make your web pages react to user input. This is the heart of interactivity. However, as you build more complex logic, you'll inevitably encounter situations where your code doesn't behave as expected. These are bugs, and finding them is a universal part of software development.
This lesson introduces you to the essential skill of debugging. For you, on your path to becoming a Design Engineer, this isn't just about fixing code; it's a core component of your "Supervising AI" and "Exploratory & Edge Case Thinking" skills. Whether you're reviewing AI-generated code or writing your own, you are the final checkpoint for quality. Being able to systematically diagnose and fix issues is what separates a novice from a professional.
Today, you will learn how to use the browser's built-in developer tools, specifically the Console and Sources panels, to debug JavaScript errors. We'll start with reading error messages and then move to a powerful, interactive method for pausing your code, inspecting its state, and pinpointing the exact cause of a problem.
The Console: Your First Line of Defense
When something goes wrong in your JavaScript, the first place the browser will tell you is the console. It's more than just a place for error messages; it's an interactive environment where you can run code and inspect the state of your page.
First, you need to know how to open it.
How To Use The Browser Console: An In-Depth Guide
This article from DebugBear gives a quick overview of the console and how to access it.
Read the section How to open the console. The keyboard shortcuts are Command+Option+J (Mac) or Control+Shift+J (Windows/Linux).
Understanding Error Messages
When an error occurs, the console provides a message that is incredibly informative. Don't be intimidated by the red text; learn to read it. An error message typically tells you three things:
- The Error Type: What kind of error it is (e.g.,
TypeError,ReferenceError). - The Message: A description of what went wrong.
- The Location: A link to the exact file and line number where the error occurred.

This TypeError is one of the most common errors in web development. It happens when you try to use a property or method on something that doesn't exist (in this case, a variable that is null). Clicking the link in the console would take you directly to line 79, where you'd likely find that a document.querySelector() call failed to find an element.
As you build more, you will develop an intuition for what these errors mean. The key is to always read them carefully first.
AI-Powered Explanations
Modern browsers are even integrating AI to help you understand errors. Since your goal is to become an expert supervisor of code and AI, this is a feature you should know about. Chrome's "Console Insights" can explain complex errors in plain English.
How To Use The Browser Console: An In-Depth Guide
The same DebugBear article shows how to enable and use this new AI feature.
Focus on the section AI Console Insights. Follow the instructions to enable this feature in your own browser's DevTools settings. It's a great example of AI assistance built right into your workflow.
From console.log to the Interactive Debugger
A common beginner's approach to debugging is to sprinkle console.log() statements throughout the code to check variable values. While sometimes useful, this is an inefficient and messy way to diagnose problems.
A much more powerful and systematic method is to use the interactive debugger in the browser's Sources panel. This tool lets you set breakpoints, which are intentional stopping points in your code. When the browser's execution hits a breakpoint, it pauses, allowing you to inspect everything: all variable values, the sequence of function calls, and more.
Let's walk through a complete debugging workflow using a practical example. This video from the Chrome for Developers team will give you a great visual overview of the process we're about to follow.
Debugging JavaScript - Chrome DevTools 101
This video introduces a buggy demo and walks through the entire debugging process, from setting breakpoints to applying a fix.
Watch the whole video. It covers: The inefficiency of console.log (compared to DevTools). Setting an event listener breakpoint to pause on a click. Using stepping controls to move through the code. Inspecting variables in the Scope and Watch panes. Testing a fix in the console and applying it.
A Step-by-Step Debugging Workflow
Now, let's solidify that workflow by reading through the official Chrome documentation, which details the same process. We will use the demo application from the documentation to get hands-on experience.
Step 1: Reproduce the Bug
The first step in fixing any bug is to be able to trigger it reliably.
Debug JavaScript | Chrome DevTools
This official guide from Chrome provides a structured tutorial for debugging. We'll start by understanding the bug.
Read the first section and follow the instructions. Open the demo page, enter 5 and 1, and see the incorrect result 51. This is a classic "string concatenation" bug. The browser is treating the numbers as text and joining them together instead of adding them.
Step 2: Pause the Code with a Breakpoint
Instead of guessing where the problem is, we'll tell the browser to pause when the user clicks the "Add" button. This is where Event Listener Breakpoints are perfect.
Debug JavaScript | Chrome DevTools
Now, let's get familiar with the debugger UI and set our first breakpoint.
Read the sections Get familiar with the Sources panel UI and Pause the code with a breakpoint. Follow the steps to open the Sources panel, find the Event Listener Breakpoints, expand Mouse, and check click. Then, click the button on the demo page. Your code execution should now be paused.
Step 3: Step Through the Code and Set a Better Breakpoint
Now that the code is paused, you can execute it one line at a time. This allows you to watch the logic unfold.
Debug JavaScript | Chrome DevTools
Here you'll learn to control the flow of execution and set a more specific breakpoint.
First, read and follow the instructions in the section Step through the code. Use the "Step over" button a couple of times. Then, to be more efficient, let's set a line-of-code breakpoint right where we think the calculation happens. Read and follow the steps in Set a line-of-code breakpoint. Remove the "click" event listener breakpoint (by unchecking it) and click the line number next to the var sum = addend1 + addend2; line to set a new breakpoint there. Click the "Resume script execution" button (the blue play icon). The code will run until it hits your new breakpoint.
Step 4: Check Variable Values
With execution paused at the critical line, it's time to investigate. The debugger gives you several ways to inspect the state of your application.
Debug JavaScript | Chrome DevTools
This is the "Aha!" moment. Here, you'll use the tools in the debugger to confirm the cause of the bug.
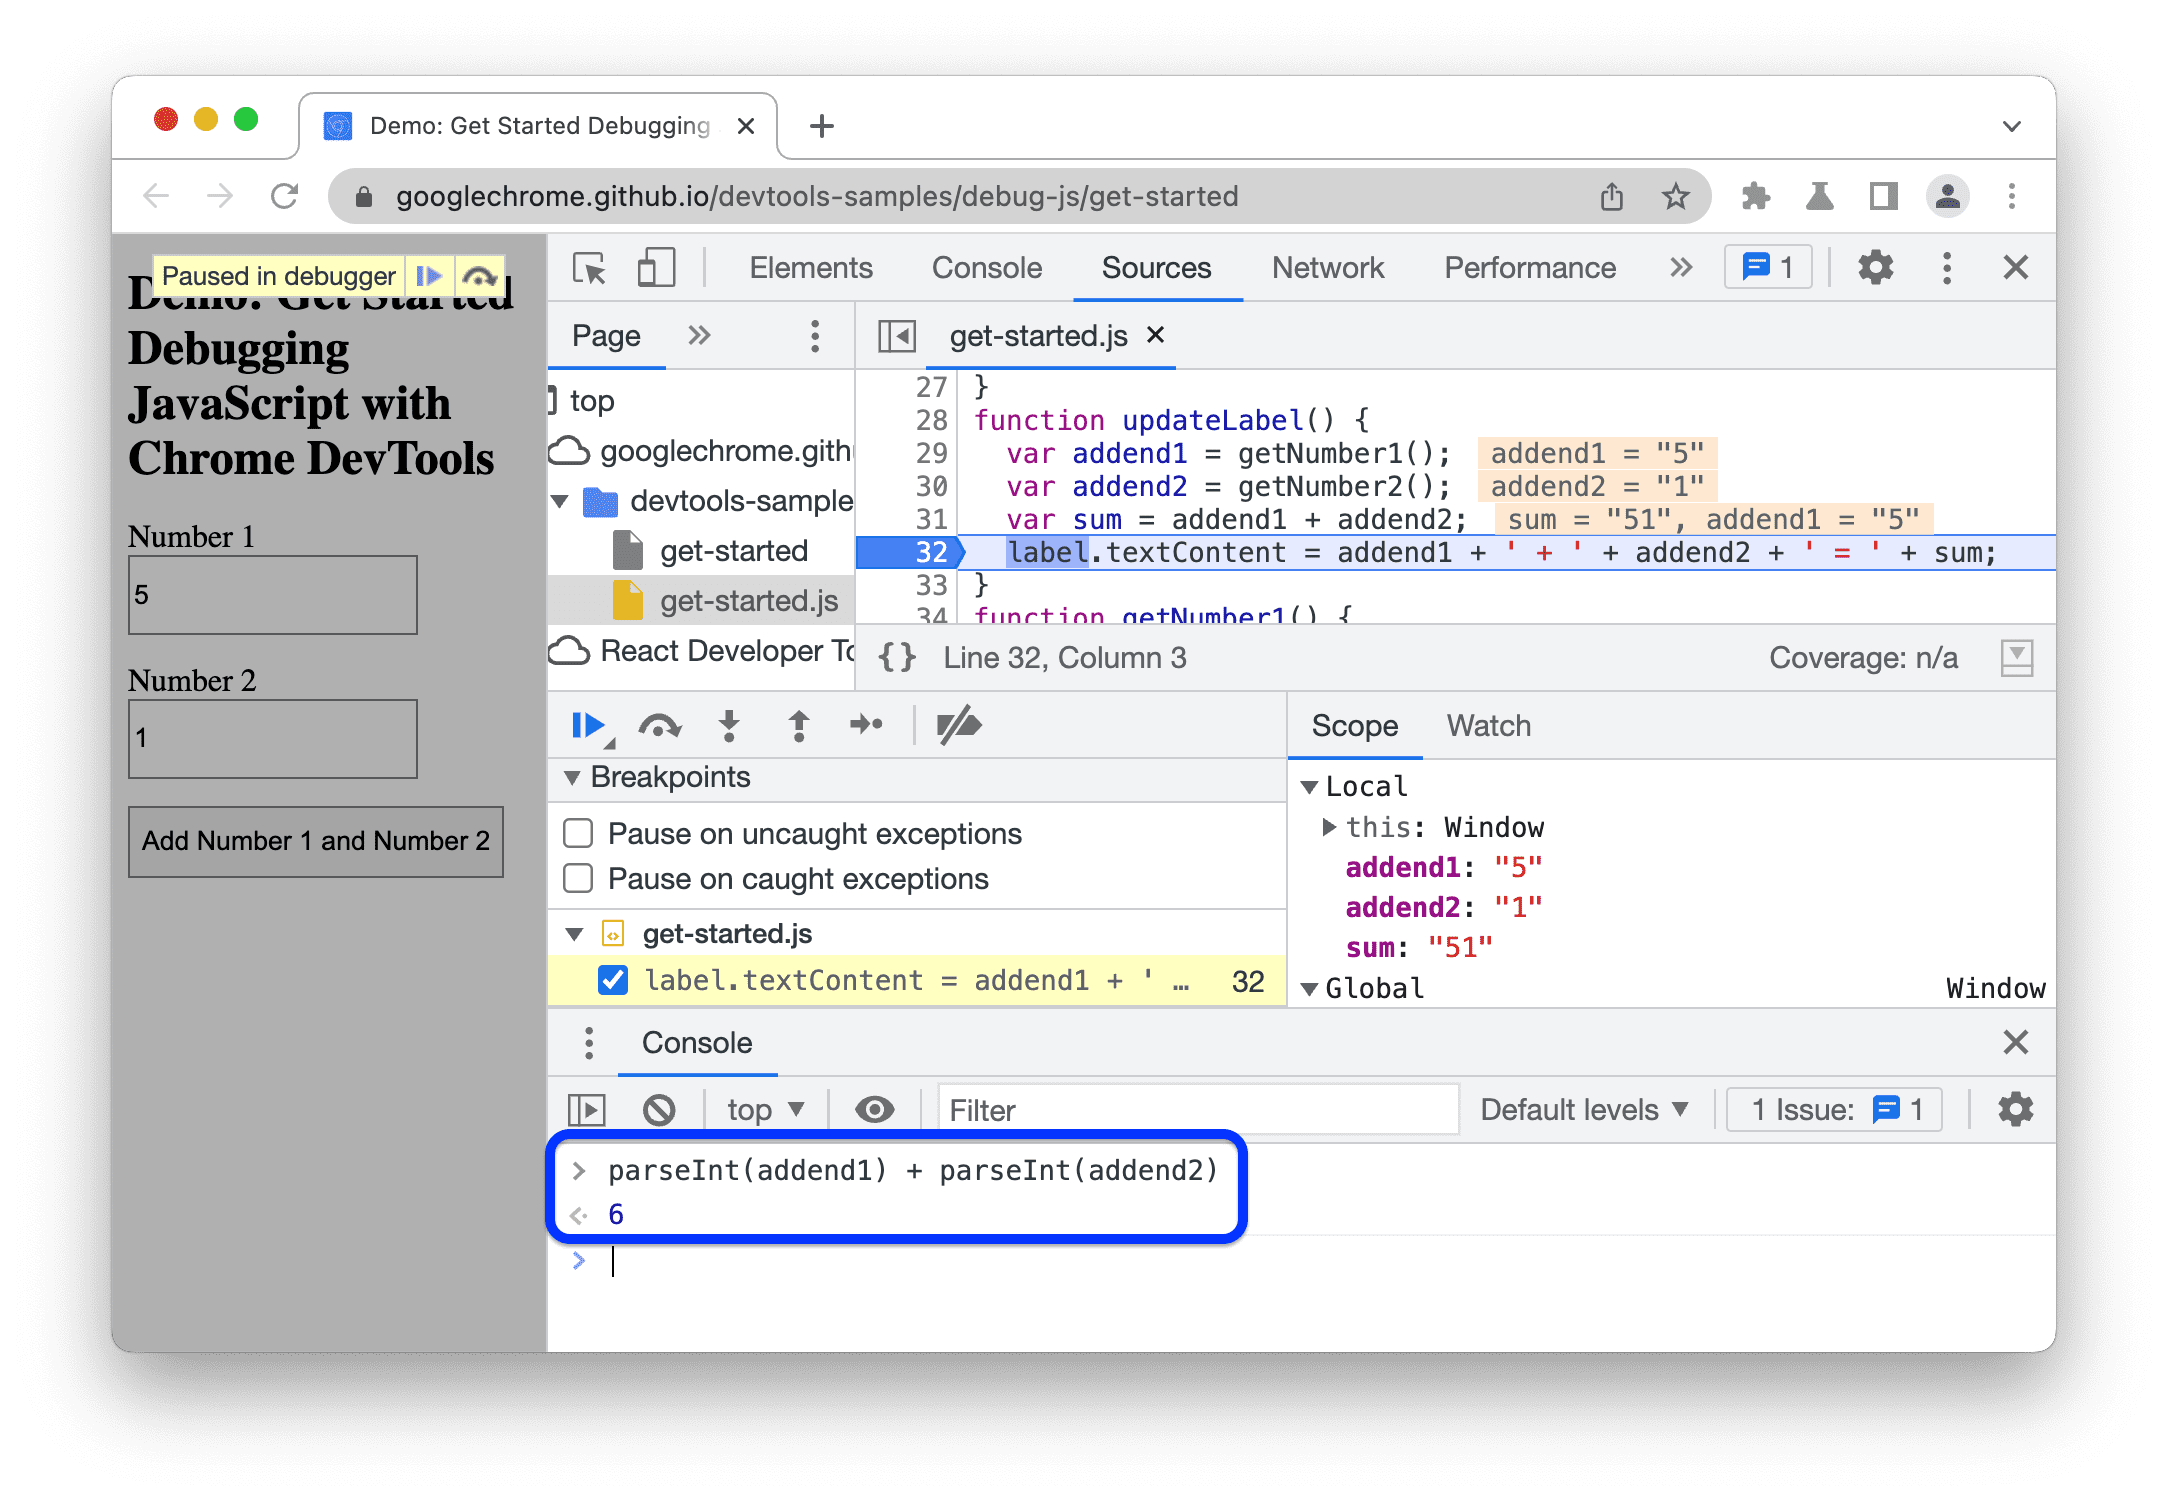
Read the entire section Check variable values. This is the most important part. Follow the instructions for all three methods: Inspect the Scope: Look at the Scope pane. You will see that addend1 and addend2 have values of "5" and "1" (in quotes), confirming they are strings. Watch expressions: Use the Watch pane to add the expression typeof sum. This will show you that the type of the sum variable is a "string". The Console: With the code paused, open the console drawer (press Esc) and type parseInt(addend1) + parseInt(addend2). Press Enter. The console will output 6. You have just used the console to test your fix live, without changing the source code.
Step 5: Apply the Fix
You've found the bug and verified the fix. The final step is to edit the code.
Debug JavaScript | Chrome DevTools
Let's apply the fix directly in the browser and see the correct result.
Read and follow the steps in the section Apply a fix. You'll edit the line of code in the Sources panel, save your changes (Ctrl+S or Cmd+S), deactivate breakpoints, and run the demo again to confirm it works.
Practice Time: Be the Debugger
Now it's your turn. Below is a simple HTML and JavaScript for a "Tip Calculator". However, it has a bug. Your task is to use the interactive debugging workflow you just learned to find and fix it.
HTML (index.html):
<!DOCTYPE html>
<html lang="en">
<head>
    <meta charset="UTF-8">
    <title>Tip Calculator</title>
</head>
<body>
    <h1>Tip Calculator</h1>

    <label for="bill-amount">Bill Amount ($):</label>
    <input type="number" id="bill-amount" value="100">
    <br><br>
    <label for="tip-percentage">Tip Percentage (%):</label>
    <input type="number" id="tip-percentage" value="15">
    <br><br>
    <button id="calculate-btn">Calculate Total</button>

    <p>Total Amount: <strong id="total-amount">$0</strong></p>

    <script src="app.js"></script>
</body>
</html>
JavaScript (app.js):
const billAmountInput = document.querySelector('#bill-amount');
const tipPercentageInput = document.querySelector('#tip-percentage');
const calculateBtn = document.querySelector('#calculate-btn');
const totalAmountDisplay = document.querySelector('#total-amount');

function calculateTotal() {
    const bill = billAmountInput.value;
    const tipPercentage = tipPercentageInput.valueAsNumber; // Oops, a mistake might be here

    const tipAmount = bill * (tipPercentage / 100);
    const total = bill + tipAmount;

    totalAmountDisplay.textContent = `$${total.toFixed(2)}`;
}

calculateBtn.addEventListener('click', calculateTotal);
The Bug: If you open this in your browser, with a bill of $100 and a tip of 15%, the total comes out to $10015.00, which is wrong. It should be $115.00.
Your Mission:
- Open the files in your browser.
- Reproduce the bug.
- Use a line-of-code breakpoint inside the
calculateTotalfunction to pause execution. - Inspect the
bill,tipPercentage,tipAmount, andtotalvariables in theScopepane. What are their types and values? - Identify the exact line where the logic goes wrong. (Hint: Look at the types of
billandtipAmountwhen they are added together). - Use the console to test a fix.
- Apply the fix to the code, save, and confirm the calculator works correctly.
Click to see the solution
The bug is that billAmountInput.value returns a string. When you add a string and a number (bill + tipAmount), JavaScript performs string concatenation.
The fix is to ensure the bill is also a number before performing the calculation. You need to change this line:const bill = billAmountInput.value;
To this:const bill = billAmountInput.valueAsNumber;
orconst bill = parseFloat(billAmountInput.value);
By using the debugger, you would have seen in the Scope pane that bill was "100" (a string) while tipAmount was 15 (a number), leading to the incorrect concatenation on the line const total = bill + tipAmount;.
Conclusion
You have now learned one of the most critical skills in a developer's toolkit. The ability to systematically hunt down and fix bugs will save you countless hours and is fundamental to shipping reliable products. It's the engine of "Shipping with Confidence."
Key Takeaways:
- The Console is your first stop. Always read error messages carefully for the type, message, and location.
- The interactive debugger is far more powerful than
console.log(). - The debugging workflow is a cycle: Reproduce -> Pause (with breakpoints) -> Step -> Inspect (Scope/Watch) -> Test & Fix (Console/Editor).
- When paused, the console is a live playground that has access to all variables in the current scope, making it perfect for testing potential fixes.
In our next module, we will start working with asynchronous code to fetch data from remote servers. This introduces a new class of potential issues related to timing and network failures. The debugging skills you've built today will be absolutely essential for diagnosing and handling those situations effectively.