Welcome to the fourth lesson in our module on Exploratory Data Analysis. In our previous sessions, you've learned how to create a variety of powerful charts to visualize distributions, relationships, and even outliers in your data. But creating a chart is only half the process. The real value for a business comes from understanding what those charts are telling you.
This lesson focuses on precisely that: translating the visual patterns you uncover into clear, plain-language statements about potential business trends. This is the bridge between technical data analysis and actionable business intelligence, a crucial skill for any data scientist. We will move from simply describing a chart to interpreting its meaning, which directly supports your goal of solving real-world problems.
From Analytics to Insight
Exploratory Data Analysis (EDA) isn't just about making plots; it's a process of inquiry that turns raw data into a strategic asset. Think of it as a four-step journey.

So far, we've focused on steps 1 and 2: gathering Data and performing Analytics (creating plots, calculating statistics). Now, we will focus on step 3: generating Insight. An insight is the "so what?" behind your analysis. It's the conclusion that explains what a pattern means in a business context. The final step, Action, is the operational change made because of that insight.
The Art of Asking "Why?"
The key to turning a visual pattern into an insight is to constantly ask probing questions. When you see a spike, a dip, a cluster, or a gap in your chart, don't just note its existence. Ask why it might be there.
This video from Christine Jiang provides an excellent overview of how experienced analysts think, moving beyond a simple EDA checklist to connect data with real-world context.
Exploratory Data Analysis Done RIGHT | Playbook Ep. 5
Watch the beginning of this video to understand the mindset of connecting data analysis to business goals.
Pay close attention to the introduction from the core theme of connecting data to real-world insights. Then, focus on the section discussing how to guide your analysis by defining North Star metrics, dimensions, and team goals. This framework helps prevent "analysis paralysis" and ensures your findings are relevant.
As the video suggests, having a clear goal (e.g., "Why did sales dip last quarter?") helps you focus your interpretation and turn observations into meaningful insights for different teams like marketing, finance, or product.
Interpreting Different Types of Analysis
Let's break down how to interpret the main types of visualizations you've learned to create. The following article provides excellent, practical examples of looking at charts and immediately writing down the business observations.
Exploratory Data Analysis (EDA) Using Python - Analytics Vidhya
This article from Analytics Vidhya walks through a full EDA project on a used car dataset. We will focus on the sections where the author draws conclusions from the visualizations.
First, review the section on Univariate Analysis. Read from the description of univariate plots through the bulleted observations that follow the code. Notice how the author translates count plots directly into statements about market share and customer preferences. Next, move to the section on Bivariate Analysis. Read from the insights derived from the pair plot and then look at the "Observations" drawn from the bar plots, such as how price relates to location, transmission, and car age. Finally, jump to the Conclusion and read the summary of insights under the heading "Through EDA, we got useful insights". This section is a perfect example of collating multiple findings into a high-level summary.
Let's formalize this process.
1. Interpreting Univariate Plots (Histograms, Count Plots)
When looking at a single variable, you're trying to understand its fundamental characteristics.
- What to look for:
- Distribution Shape (Histograms): Is it symmetric (like a bell curve), skewed left/right, or multimodal (multiple peaks)?
- Central Tendency: Where is the center of the data? (e.g., the median bar).
- Frequency (Count Plots): Which categories are most or least common?
- Business Questions to Ask:
- What is the most common behavior, product, or customer attribute?
- Are there distinct groups within this single variable (e.g., two peaks in customer age)?
- Is there a significant imbalance in our categories (e.g., 95% of customers use one feature and ignore the rest)?
Example:
- Visual Pattern: A histogram of customer order values is heavily right-skewed, with most orders under $50 and a long tail of orders going up to $1000.
- Business Insight: "The vast majority of our sales are small, everyday purchases. However, a small but significant number of high-value orders exist, suggesting a 'whale' customer segment that could be targeted with premium services or a loyalty program."
2. Interpreting Bivariate Plots (Scatter Plots, Bar Plots)
When comparing two variables, you're looking for relationships.
- What to look for:
- Correlation (Scatter Plots): Is there a positive (upward trend), negative (downward trend), or no relationship? Is it linear or curved?
- Categorical Comparison (Bar Plots): How does a metric (like average sales, or count of users) change across different categories (like regions, marketing channels)?
- Clusters & Outliers: Are there distinct groups of points? Do any points defy the main trend?
- Business Questions to Ask:
- Does one factor seem to influence another (e.g., does more marketing spend lead to more sales)?
- Which segment or category performs the best/worst according to our key metric?
- Are there combinations of factors that lead to exceptional outcomes (e.g., a specific product in a specific region is unusually successful)?
Example:
- Visual Pattern: A bar chart shows the average customer satisfaction score by support channel. "Email" support has an average score of 3.1/5, "Phone" has 3.9/5, and "Live Chat" has 4.6/5.
- Business Insight: "Customers who use our Live Chat feature report significantly higher satisfaction than those using email or phone support. Investing in and promoting the Live Chat channel could be a key strategy for improving overall customer satisfaction."
Putting It All Together: Answering a Business Question
The ultimate goal of EDA is to synthesize these individual insights to answer a broader business question. This involves a structured process of exploration, hypothesis, and verification, all driven by the data.
This video provides a fantastic, practical demonstration of this entire process in Python. The presenter starts with a clear question and uses pandas and seaborn to find the answer.
Exploratory Data Analysis with Pandas Python
This clip from Rob Mulla's "Exploratory Data Analysis with Pandas" tutorial shows the final, and most important, step of EDA: using your tools to answer a specific question.
Watch the section from "Ask a question about the data". The presenter formulates a clear business question: "What are the locations with the fastest roller coasters?". He then uses grouping, aggregation, and filtering to isolate the relevant data and creates a bar chart to present the final answer. This is a perfect, concise example of insight-driven analysis.
This approach—posing a question, manipulating the data to address it, and visualizing the result—is the core workflow of a data analyst.
Let's practice this with a quick example. Look at the dashboard below, which shows an EDA summary of a dataset about individuals.
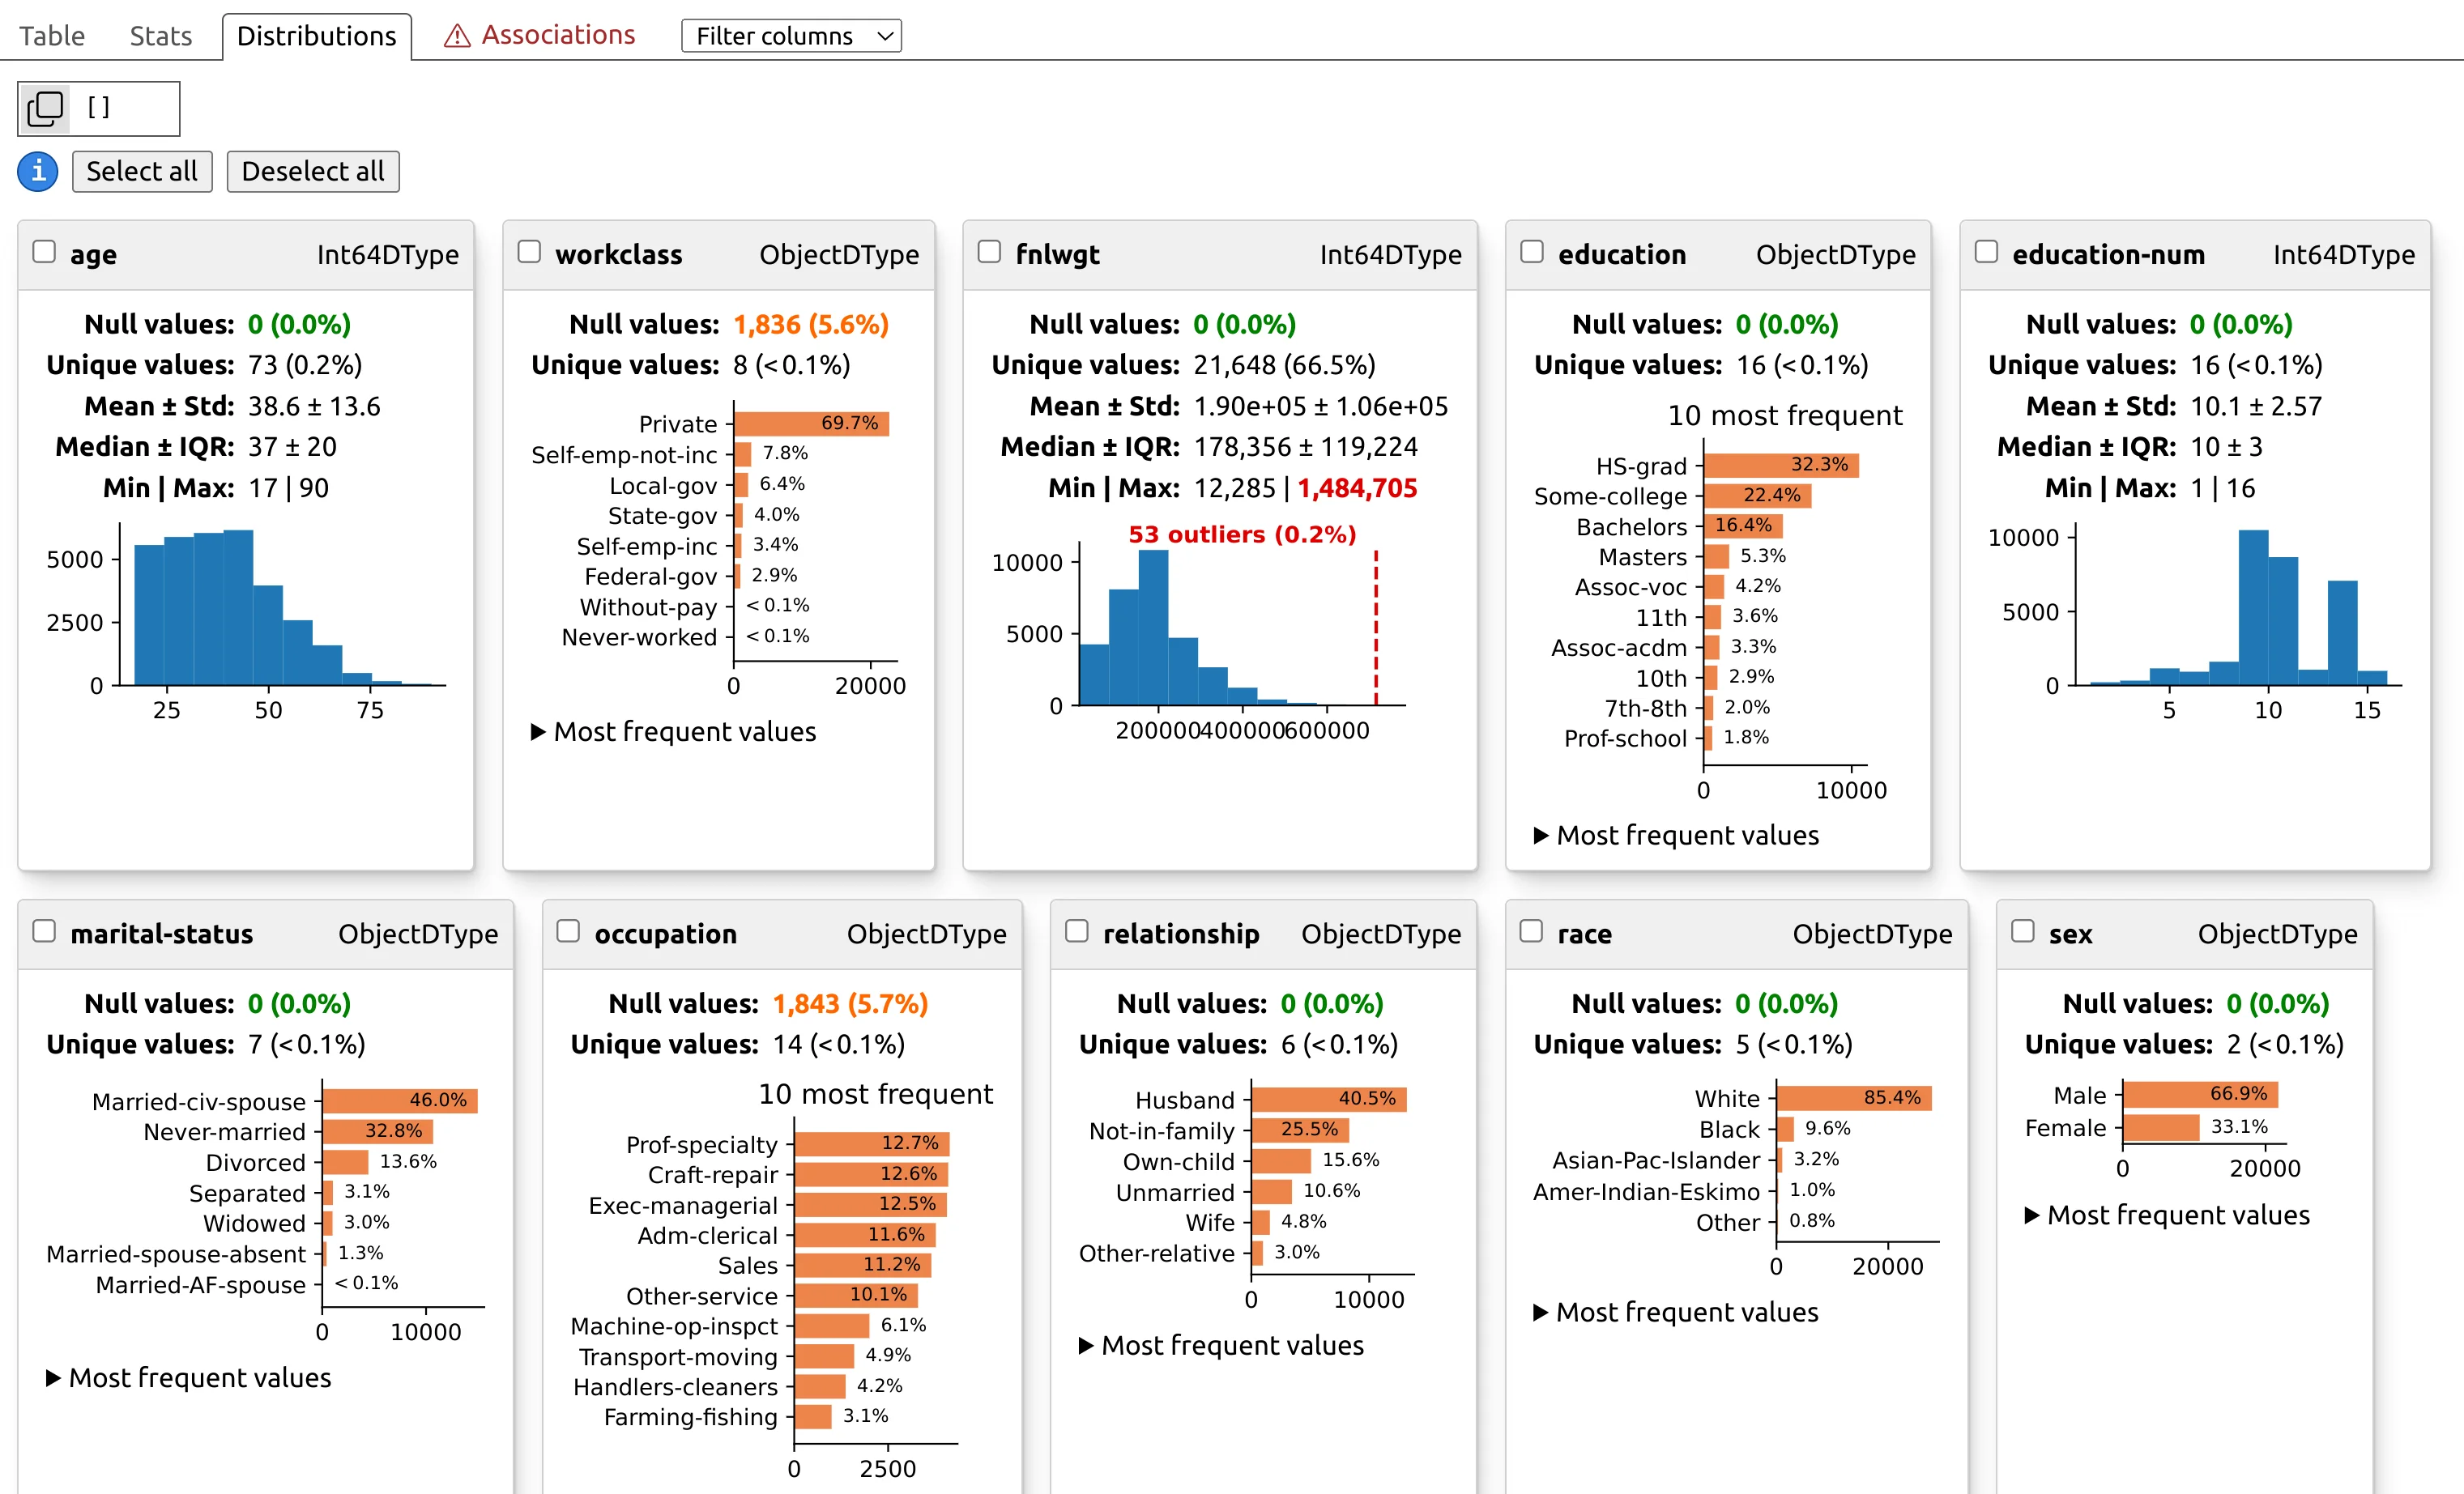
Let's interpret two of these charts:
agehistogram: We see the data is skewed to the younger side, with the highest concentration of people between their 20s and 40s.- Business Insight: "Our primary audience consists of young to middle-aged adults. Marketing campaigns and product features should be tailored to the preferences and digital habits of this demographic."
relationshipbar chart: We see that "Husband" and "Not-in-family" are the two largest categories.- Business Insight: "A large portion of our user base consists of married men and un-attached individuals. This might suggest two distinct user personas with different needs—one family-oriented, the other individual-oriented—which could be targeted with separate messaging."
Conclusion
In this lesson, you've learned the critical skill of moving from visualization to interpretation. This is what makes data analysis valuable to a business. By asking "why" and connecting patterns to a business context, you can generate powerful insights that drive decisions.
Key Takeaways:
- Data analysis is a journey from Data -> Analytics -> Insight -> Action. Your role as an analyst is to produce the "Insight".
- Translate visual patterns into plain-language business statements by asking "so what?".
- Univariate analysis helps you understand the composition of your data (e.g., "Most of our customers are in the 25-34 age bracket").
- Bivariate analysis helps you uncover relationships and drivers (e.g., "Increased ad spend is correlated with higher sales").
- The most powerful analysis starts with a specific business question and uses visualizations as tools to find the answer.
In the next lesson, we will take this skill one step further. You will learn how to structure a concise summary of your EDA findings, combining your key visualizations and plain-language insights into a coherent report or presentation for a stakeholder.