Welcome to the next lesson in our exploration of data. In the last session, we focused on uncovering relationships between variables using scatter plots and correlation heatmaps. We saw how visualizing data can reveal patterns, but sometimes, those same plots can highlight points that don't fit the pattern at all. These are outliers.
This lesson directly addresses the learning outcome of detecting and analyzing outliers using a robust statistical method. We'll define what outliers are, discuss why they are critical in a business context, and then implement the Interquartile Range (IQR) rule in Python to systematically find them. Understanding outliers is not just about cleaning data; it's about uncovering potential errors, unique opportunities, or valuable anomalies that can drive business decisions.
What is an Outlier and Why Should You Care?
In simple terms, an outlier is a data point that is significantly different from other observations in a dataset. These can be abnormally high or low values.
How To Find Outliers Using Python [Step-by-Step Guide]
To start, let's get a formal definition of an outlier and understand how they can occur.
Read the introductory section, What is an outlier?. This part explains the concept and the potential sources of outliers, from natural variation to data entry errors.
In a business context, outliers can be either a problem or an opportunity:
- A Problem: Outliers can dramatically skew summary statistics like the mean. For example, a single multi-million dollar sale could make the average sale value misleadingly high, affecting business forecasts or performance evaluations. Machine learning models can also be sensitive to them, leading to poor predictions.
- An Opportunity: Sometimes, an outlier is the most interesting point in the dataset. It could represent a fraudulent transaction that needs investigation, a "super-user" with extremely high engagement, or a manufacturing defect that needs to be addressed. Ignoring them would mean missing valuable insights.
How to detect outliers using IQR and Boxplots? - machinelearningplus
This article provides a concise explanation of why handling outliers is a critical step in any data analysis project.
Focus on the section Why should you treat the outliers?. It clearly illustrates how outliers can mislead algorithms and impact statistical measures like correlation.
Visualizing Outliers with Box Plots
Before we dive into statistical calculations, let's use a tool you're already familiar with: the box plot. As we saw in a previous lesson, box plots are excellent for visualizing the distribution of a single variable, and they are specifically designed to highlight outliers.

The points shown beyond the "Minimum" and "Maximum" whiskers are potential outliers. This visual check is a great first step to understanding if a feature in your dataset has extreme values.
The IQR Method: A Statistical Approach to Outlier Detection
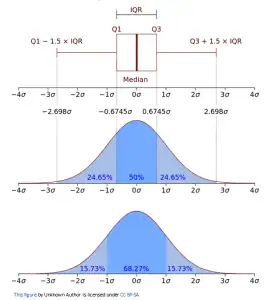
While visual inspection is useful, it isn't precise. For a systematic and quantifiable way to identify outliers, we use the Interquartile Range (IQR) method. This is the statistical rule that box plots use to determine where the whiskers end.
Here is the logic:
- Find the Quartiles:
- Q1 (First Quartile): The 25th percentile. 25% of the data falls below this value.
- Q3 (Third Quartile): The 75th percentile. 75% of the data falls below this value.
- Calculate the IQR:
- The IQR is the range of the middle 50% of the data.
- Define the Outlier "Fences":
- Lower Fence:
- Upper Fence:
- Identify Outliers: Any data point that falls below the lower fence or above the upper fence is considered an outlier.
Implementing the IQR Method in Python
Now let's translate this theory into a practical Python implementation. The following video gives a clear, step-by-step explanation of the concept and the code.
Outlier detection and removal using IQR | Feature engineering tutorial python # 4
This video from the channel codebasics provides an excellent conceptual breakdown of percentiles and IQR before walking through the Python code.
Watch from the beginning to the end of the implementation. The first part (theory explanation) covers the "why" behind the formulas. The second part (coding walkthrough) shows you exactly how to do it in pandas.
Following the logic from the video, here is a complete code snippet you can adapt for your own projects. Let's assume you have a pandas DataFrame df and want to find outliers in a column named 'sales_amount'.
import pandas as pd
import numpy as np


# Sample DataFrame (replace with your data)
data = {'sales_amount': [120, 125, 118, 130, 140, 110, 105, 135, 95, 500, -50, 122, 128]}
df = pd.DataFrame(data)


# 1. Calculate Q1 and Q3
Q1 = df['sales_amount'].quantile(0.25)
Q3 = df['sales_amount'].quantile(0.75)


# 2. Calculate IQR
IQR = Q3 - Q1


# 3. Define the fences
lower_fence = Q1 - 1.5 * IQR
upper_fence = Q3 + 1.5 * IQR

print(f"Q1: {Q1}, Q3: {Q3}, IQR: {IQR}")
print(f"Lower Fence: {lower_fence}, Upper Fence: {upper_fence}")


# 4. Identify outliers
outliers = df[(df['sales_amount'] < lower_fence) | (df['sales_amount'] > upper_fence)]

print("\nOutliers found:")
print(outliers)
In this example, the values 500 and -50 would be correctly identified as outliers because they fall far outside the calculated fences.
Analyzing and Handling Outliers
Detecting outliers is only half the battle. The next, more critical step is deciding what to do with them. You should not automatically delete them. The correct action depends entirely on the business context.
Here are three common strategies:
-
Investigation (Always the First Step): Before you do anything, understand the outlier. Is a sales amount of
$500,000an error, or did a major corporate client make a huge purchase? Is a negative value foritems_in_carta system bug? Context is everything. -
Removal (Trimming): If you've confirmed an outlier is a data entry error or impossible value (e.g.,
age = 250), removing it is often the best choice. This prevents the error from corrupting your analysis. You can create a new DataFrame that excludes the outliers.# Create a new DataFrame without the outliers df_no_outliers = df[~((df['sales_amount'] < lower_fence) | (df['sales_amount'] > upper_fence))] print("\nDataFrame after removing outliers:") print(df_no_outliers) -
Capping (Winsorizing): If outliers are genuine but extreme, and you don't want to lose the entire row of data, you can "cap" them. This means replacing the outlier values with the lower or upper fence value. This tones down their effect while keeping the record.
The following video demonstrates both trimming and capping using the IQR method.
How to Detect and Remove Outliers in the Data | Python
This video from Hackers Realm clearly shows the code for both trimming and capping outliers after identifying them with the IQR method.
Focus on the section covering the Interquartile Range method, from start to finish. It shows how to find the outliers and then provides distinct code blocks for both trimming the data and capping the values.
Key Takeaways
You've now learned a powerful and standard technique for one of the most common data cleaning tasks.
- Outliers are extreme data points that can skew your analysis or reveal important information.
- Box plots provide a quick visual way to spot potential outliers.
- The IQR method provides a robust statistical rule to systematically identify outliers by defining
lowerandupperfences based on the data's quartiles. - The decision to handle outliers (by removing, capping, or simply analyzing them separately) is a strategic one that depends entirely on the business context and the nature of the outlier.
In our next lesson, we will synthesize everything we've learned in this module. You'll practice translating the visual patterns and statistical findings from your EDA—including distributions, relationships, and outliers—into concise, plain-language statements that can inform business strategy.