Welcome to the final lesson in our module on Exploratory Data Analysis! So far, you have learned how to create powerful visualizations to understand distributions, relationships, and outliers. In our last session, you practiced the crucial skill of translating those visual patterns into plain-language business insights. Now, we'll take the final step: packaging those insights into a compelling narrative for others.
This lesson is about structuring a concise summary of your EDA findings, complete with key visualizations and initial hypotheses. This is where your analytical work transforms into a strategic asset for an organization. Mastering this skill is essential for ensuring your hard-earned insights drive real-world decisions, which aligns perfectly with your goal of applying data science to solve business problems.
The Goal of EDA: Communicating Insights
Exploratory Data Analysis is a cycle that begins with raw data and ends with clear conclusions. The final, and arguably most important, step is communicating what you've found.
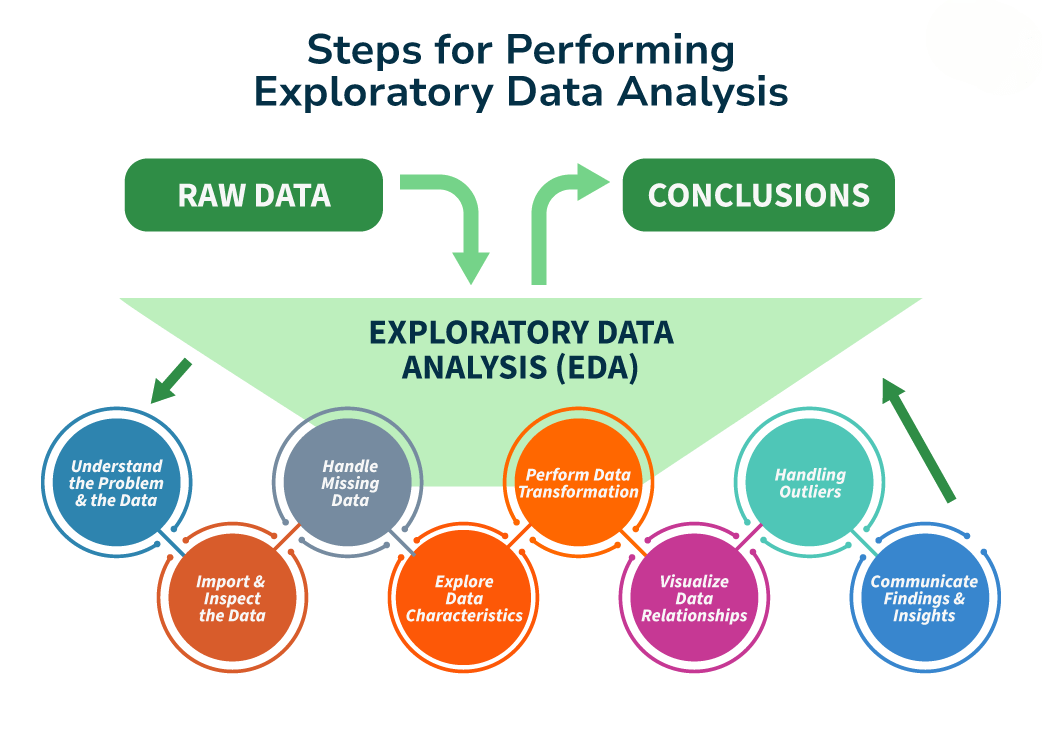
This infographic shows the full EDA workflow. Our focus in this lesson is on the final step: "Communicate Findings & Insights," where you report the story you've uncovered in the data.
Your analysis is only valuable if its message is received and understood by stakeholders—the managers, marketers, or engineers who will act on it. A well-structured summary bridges the gap between your technical work and their business objectives.
Start with the End in Mind: Audience and Scope
Before you even write a single sentence of your summary, you must be clear on two things: your audience and your objective. Who are you presenting to, and what decision do they need to make? Answering these questions prevents you from getting lost in the data and ensures your summary is relevant and impactful.
The following video by Christine Jiang, an experienced data leader, brilliantly explains how to do this through "requirements gathering." This process turns a vague request into a well-defined project with a clear deliverable.
How to NAIL Exploratory Data Analysis | Playbook Ep. 4
Watch this segment on the importance of gathering requirements before starting your analysis.
Pay close attention to the discussion on narrowing the scope and defining the metric, dimensions, and deliverable. The role-play example starting around this timestamp shows how a vague question like "how did sales look?" becomes a concrete, actionable task.
Defining your audience and goals upfront ensures your final summary is tailored to their needs. A report for a technical team might include more statistical detail, while a report for the marketing department should focus on customer behavior and campaign performance.
A Practical Tool: The Insights Log
A great summary doesn't appear out of thin air. It's built from the small discoveries you make throughout your analysis. A highly effective and practical technique is to maintain an insights log as you work. This is a simple document where you systematically record your findings.
In the same video, Christine Jiang demonstrates this powerful method.
How to NAIL Exploratory Data Analysis | Playbook Ep. 4
Now, let's see how to use an "insights log" to keep your findings organized.
First, watch from this section where she introduces the SCAN framework, which helps structure your initial exploration. Then, see how she creates and populates an insights log from this point and continues to extract and document key findings from this longer segment.
As you saw, an insights log is a structured way to capture your thoughts. For each significant pattern you find, you should note:
- The Finding: A clear, one-sentence observation (e.g., "The gaming monitor is the top-selling product.").
- The Visualization: The chart that proves your finding.
- The Business Insight: The "so what?" for the business (e.g., "This product is a major revenue driver and could be a candidate for a marketing push.").
- Initial Hypothesis: A testable idea that follows from the insight (e.g., "We hypothesize that bundling the gaming monitor with the low-selling gaming headset could boost headset sales.").
- Relevant Audience: Which team would care about this? (e.g., Sales, Marketing, Product).
Keeping this log makes writing the final summary incredibly efficient. Instead of trying to recall everything from memory, you'll have a pre-built list of your most important points to draw from.
The Anatomy of an EDA Summary
With your insights log populated, you're ready to build your summary. While the format can vary (from a slide deck to a memo or a dashboard), the core components are generally the same. A well-structured report guides your audience through your analysis logically and persuasively.
The article "What is Ad Hoc Analysis and Reporting?" provides a professional template for structuring analytical reports. This framework is directly applicable to summarizing your EDA.
What is Ad Hoc Analysis and Reporting? Process, Examples | Appinio Blog
This article provides an excellent, industry-standard structure for reporting analytical findings. We will adapt this structure for our EDA summary.
Please read the section titled "How to Report Ad Hoc Analysis Findings?". Start from the subsection 1. Structure the Report and read through its 8 points. Then, continue with subsection 2 on communication and subsection 4 on choosing visuals. Focus on understanding the purpose of each section.
Based on that structure, here is a practical framework for your EDA summary:
-
Executive Summary: Start with the conclusion. In 2-3 sentences, state your most critical findings and top recommendation. A busy executive might only read this part.
- Example: "Our analysis of student performance reveals that study time and attendance are the strongest predictors of academic success. We recommend launching an attendance monitoring program and workshops on effective study habits to lift average grades."
-
Introduction: State the business problem you were investigating and briefly describe the dataset you used.
- Example: "To understand the key drivers of student grades, we analyzed a dataset of 500 students containing demographic, social, and academic features."
-
Key Findings: This is the core of your report. Present your 3-5 most important insights from your log. For each finding:
- State the insight in plain language.
- Show the key visualization that supports it.
- Provide a brief interpretation of the chart.
-
Initial Hypotheses & Recommendations: Synthesize your findings into broader themes. What are the underlying stories? Based on these stories, propose initial, data-driven hypotheses that the business could test.
- Example: "Finding: Higher family income correlates positively with grades. Hypothesis: Students from lower-income families may lack access to key resources. Recommendation: We should pilot a program offering free tutoring to students from low-income backgrounds to see if it closes the grade gap."
-
Conclusion & Next Steps: Briefly reiterate your main message. Suggest what further analysis could be done to validate your hypotheses (this sets the stage for modeling!).
The ultimate goal is to create a compelling narrative that is easy to digest. A great summary might be presented as a dashboard, combining interactive filters and key charts to tell the story visually.
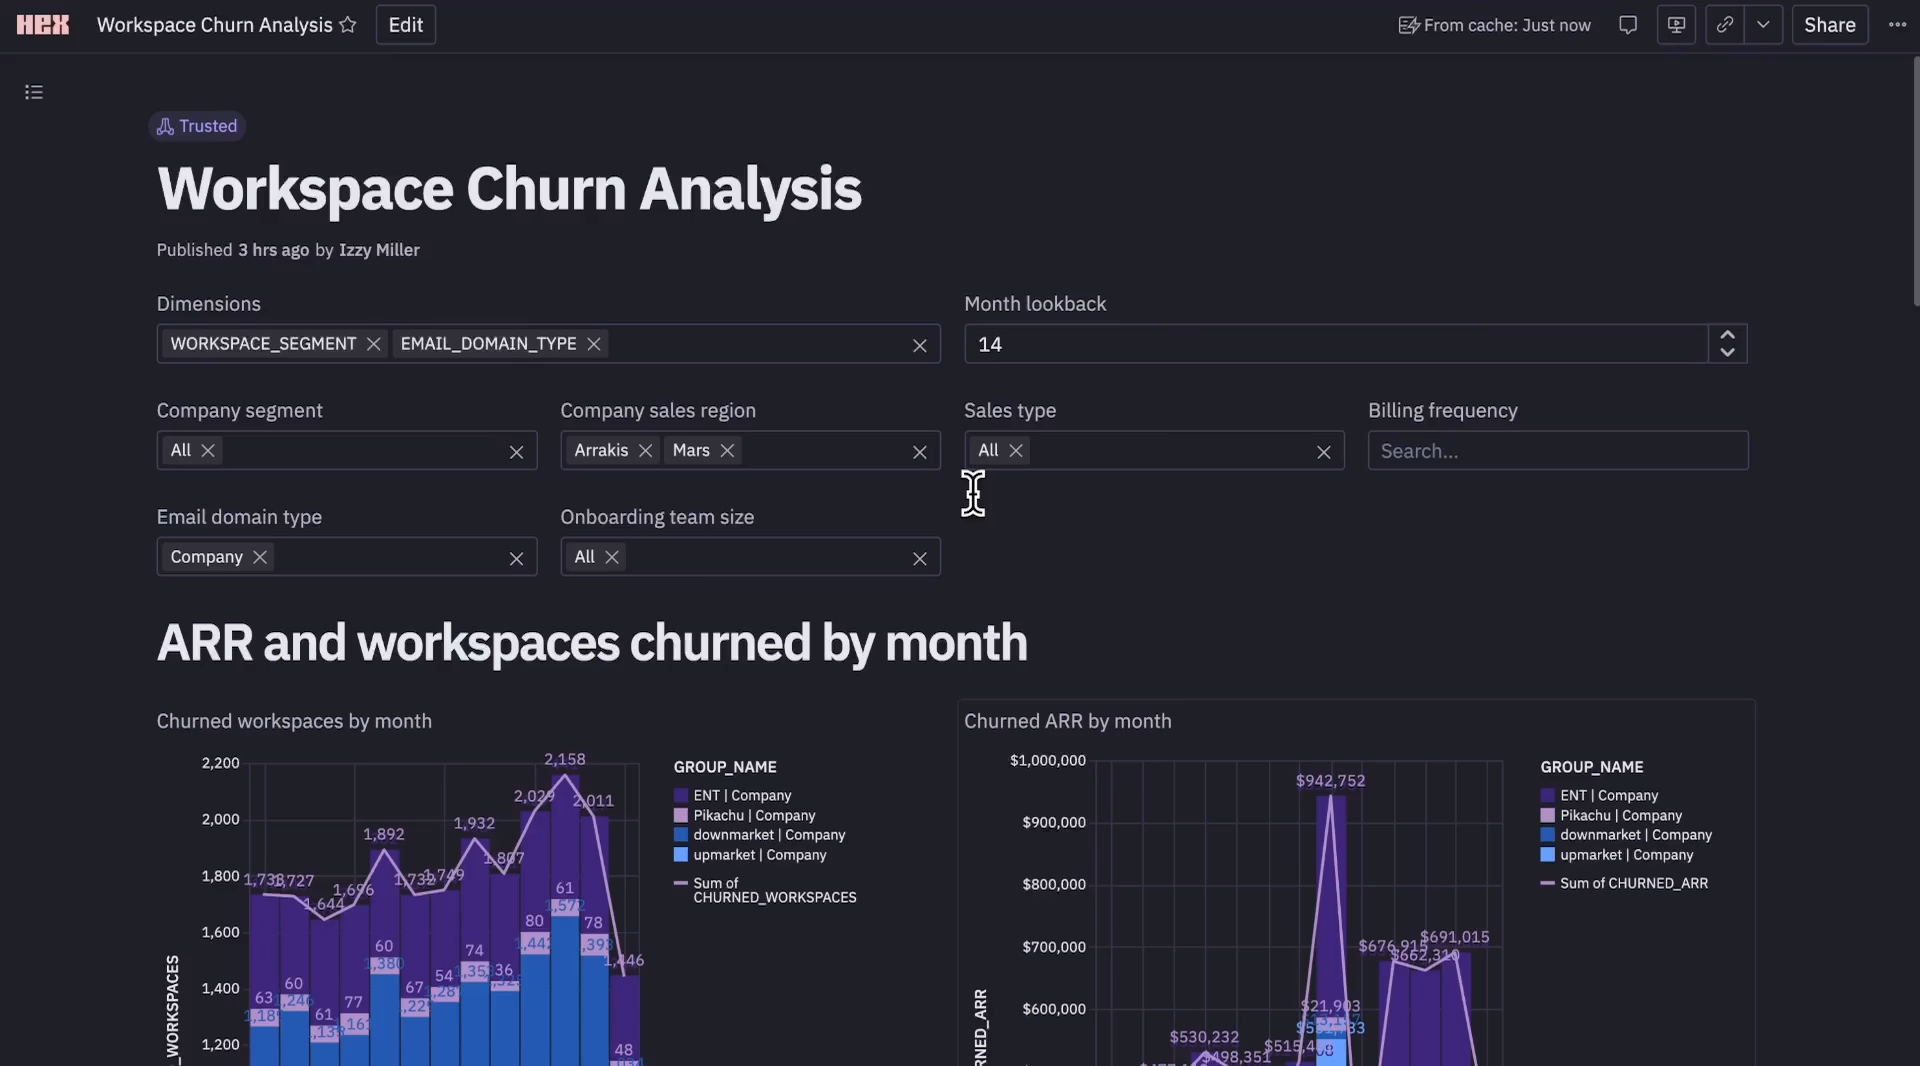
This interactive dashboard is an excellent example of a polished EDA summary. It presents key metrics ("Churned workspaces") and allows stakeholders to filter by important dimensions ("Company segment"), enabling them to explore the findings themselves.
Case Study: Student Performance Analysis
Let's see this structure in action. The following article walks through an EDA on a student performance dataset. It performs several analyses and, most importantly, concludes with a concise summary of insights and recommendations.
Exploratory Data Analysis (EDA): Why It’s Crucial for Data Science | Udacity
This article provides a complete, practical example of conducting an EDA and summarizing the results.
Skim through Steps 1 and 2 to understand the dataset and the initial analysis. Then, read the correlation analysis carefully. Finally, focus on the last section, Insights and Recommendations. Notice how it crystallizes all the prior analysis into three clear, actionable points.
The "Insights and Recommendations" section of the Udacity article is a perfect example of a concise EDA summary. It doesn't show every chart—only the key takeaways that lead directly to actionable advice.
Conclusion
In this lesson, you've learned how to transform your exploratory analysis into a structured, persuasive summary. This is the skill that ensures your data science work has a real-world impact. By focusing on your audience, organizing your discoveries in an insights log, and following a clear reporting structure, you can communicate your findings with clarity and confidence.
Key Takeaways:
- An EDA summary translates your technical work into actionable business intelligence.
- Always begin by defining your audience and the decision your analysis needs to support.
- Use an insights log during your analysis to systematically document findings, making the final summary easier to write.
- Structure your summary logically: Executive Summary, Introduction, Key Findings (with visuals), Recommendations, and Conclusion.
- Select only the most impactful visualizations that tell the core story of your data.
You have now completed the module on Exploratory Data Analysis! You have the skills to take a raw dataset, clean it, explore it visually, interpret the patterns, and summarize your findings in a professional report.
In our next module, Feature Engineering and Preprocessing, we will shift gears. Armed with the hypotheses from your EDA, you will learn how to prepare your data for predictive modeling. We will cover techniques to transform raw features into a format that machine learning algorithms can understand, setting the stage for building and testing models.