Introduction
In the previous lesson, we focused on combining data from multiple sources into a single, unified DataFrame using pd.merge(). Now that you have a complete and clean dataset, the next logical step in any analysis is to start summarizing it to uncover high-level patterns and insights. How do sales compare across different regions? What is the average user engagement per marketing channel? Answering these questions requires boiling down large amounts of data into meaningful summary statistics.
This lesson addresses exactly that. You will learn how to group and aggregate data to compute initial summary statistics. We will explore the powerful groupby() method in pandas, a cornerstone of data analysis. The core concept you'll master is the "Split-Apply-Combine" strategy, a mental model that simplifies the process of performing calculations on different subsets of your data.
The Split-Apply-Combine Strategy
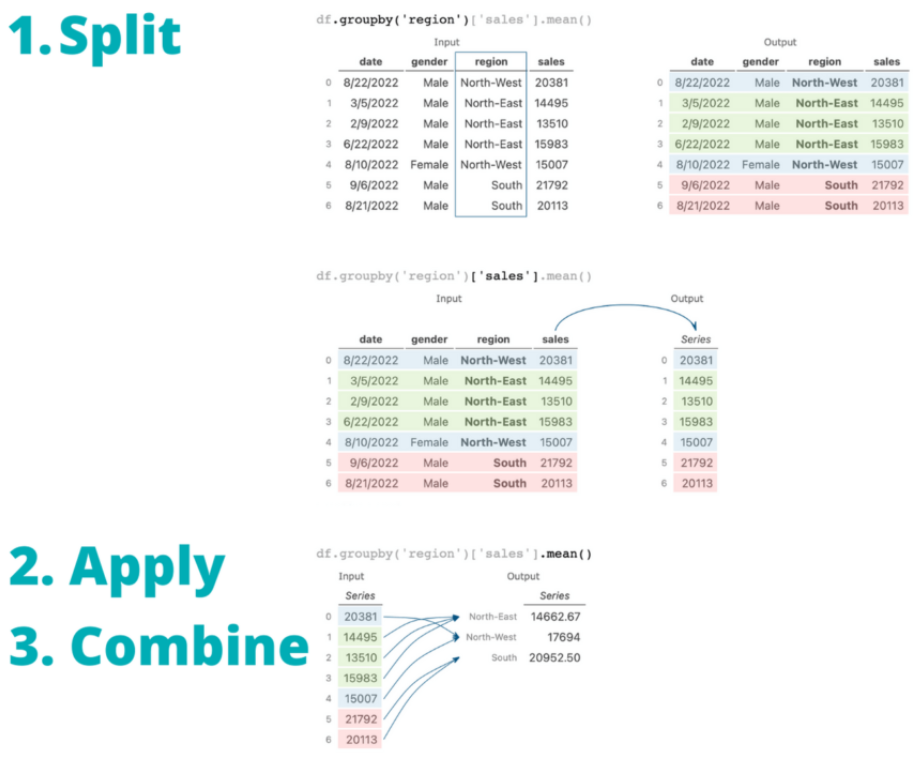
At its heart, a groupby operation is a three-step process:
- Split: The data is broken down into groups based on some criteria you define (e.g., by country, product category, or date).
- Apply: A function is independently applied to each of these groups. This function could be a simple aggregation like
sum()ormean(), or a more complex custom operation. - Combine: The results of the function application on all groups are collected and combined into a new data structure, typically a pandas Series or DataFrame.
This image provides a clear visual breakdown of the process. An initial DataFrame is split into groups by region, a function (mean()) is applied to the 'sales' column of each group, and the results are combined into a new Series showing the average sales for each region.
To understand this process conceptually, the following video provides a great walkthrough.
Python Pandas Tutorial (Part 8): Grouping and Aggregating - Analyzing and Exploring Your Data
Corey Schafer from the self-named channel provides an excellent, step-by-step explanation of what a groupby operation does. He creates a DataFrameGroupBy object and then uses .get_group() to inspect an individual group, making the "split" step very tangible.
Please watch the section from grouping your data. Focus on how the original DataFrame is split into a DataFrameGroupBy object, and how you can then access a single group (like 'United States' or 'India') from this object.
Performing Aggregations on Groups
Once you have a GroupBy object, the "apply" step is where you generate insights. An aggregation is any function that takes multiple values and returns a single summary value. Common examples include mean(), median(), sum(), count(), and max().
You can apply these functions directly to a column of your GroupBy object. For instance, to find the median salary for each country, you would group by country, select the salary column, and then call .median().
A more powerful and efficient approach is using the .agg() method, which allows you to apply multiple aggregation functions at once.
Python Pandas Tutorial (Part 8): Grouping and Aggregating - Analyzing and Exploring Your Data
This part of the video demonstrates how to apply both a single aggregation (.median()) and multiple aggregations (.agg(['median', 'mean'])) to the grouped data.
Watch these two short segments: First, watch the demonstration of a single aggregation to see how to calculate the median salary per country. Next, watch the segment on using the .agg() method to apply multiple functions simultaneously.
Pandas comes with a rich set of built-in aggregation functions. The following article provides an excellent overview of the most common ones.
Comprehensive Guide to Grouping and Aggregating with ...
This article from Practical Business Python serves as a great reference for the various aggregation functions available in pandas.
Please read the following two sections: Basic math: This covers the most common numerical aggregations like sum, mean, median, min, max, and std. Counting: This section explains the important differences between count, nunique, and size. Understanding when to use each is crucial for accurate analysis.
A Practical Workflow: Answering a Business Question
Now, let's tie this all together in a realistic workflow. This is where groupby moves from a technical function to a tool for answering business questions. Imagine you're an analyst for a company that runs amusement parks, and a stakeholder asks: "What are our locations with the fastest roller coasters, on average? Let's only consider parks with at least 10 coasters."
The following video demonstrates exactly how to answer this question from start to finish.
Exploratory Data Analysis with Pandas Python
In this excellent segment, Rob Mulla walks through a complete EDA mini-project. He formulates a question, then uses a chain of pandas methods—including filtering, grouping, aggregating, and sorting—to arrive at a clear answer. This is a perfect template for the kind of practical analysis you're aiming to master.
Watch the entire section on asking a question about the data. Pay close attention to the sequence of operations: Filtering the initial DataFrame to exclude irrelevant data. Grouping by the location column. Aggregating using .agg() to get both the mean speed and the count of coasters for each location. Filtering again on the aggregated result to keep only locations with count >= 10. Sorting the final result by mean speed to find the fastest parks. Plotting the results for a clear presentation.
This end-to-end process is a powerful pattern that you will use constantly in your data science work.
Advanced Aggregations with Custom Functions
Sometimes, built-in functions like mean or sum aren't enough. You might need to perform a more complex or custom calculation on each group. For this, you can use the .apply() method with a Python lambda function.
For example, let's say you want to find out what percentage of developers in each country from our survey dataset use Python. This requires more than a simple aggregation; you need to:
- Count the total number of respondents from each country.
- Count the number of respondents in each country whose list of known languages contains "Python".
- Calculate the percentage from these two counts.
The following video segments walk through this exact problem, demonstrating how to use .apply() for the custom counting logic and then how to combine the results to calculate the final percentage.
Python Pandas Tutorial (Part 8): Grouping and Aggregating - Analyzing and Exploring Your Data
This is a fantastic example of a multi-step analysis that reflects a real-world problem. It shows why .apply() is necessary for complex logic and how to synthesize multiple pieces of information into a final result.
Please watch these two connected segments: Start with the section explaining how to use .apply() with a lambda function to count the number of Python users in each country. Notice why a direct string method fails on a GroupBy object. Continue with the next section, which shows how to calculate the final percentage. This involves creating two separate Series (total respondents and Python users), concatenating them into a new DataFrame, and then calculating a new column based on the other two. This is a very common and powerful pattern.
While .apply() is flexible, it's worth noting that it can be slower than using pandas' built-in, vectorized functions. Whenever possible, try to express your logic using functions like .agg() or direct arithmetic on Series. When that's not possible, .apply() is your go-to tool.
Conclusion
In this lesson, you've learned one of the most fundamental operations in data analysis: grouping and aggregating. This skill allows you to move from raw, row-level data to summarized, high-level insights that are essential for any business.
Here are the key takeaways:
- The Split-Apply-Combine model is the conceptual framework for all
groupbyoperations. - You can apply simple aggregations like
.mean()or.count()directly, or use.agg()to efficiently apply multiple functions at once. - For complex, custom logic that can't be handled by built-in functions,
.apply()with a lambda function provides maximum flexibility. - Grouping and aggregating is not just a single command, but a central part of a larger analysis workflow used to answer specific, practical questions.
You are now at the end of the first module, "Project Foundation and Data Acquisition." You've learned how to define a problem, load data, clean it, merge it, and now, summarize it. In our next module, "Exploratory Data Analysis for Business Insights," we will build directly on these skills. The first lesson will focus on creating histograms and box plots, which will allow you to visually explore the distributions of the summary statistics and features you've just learned to compute.