Hello! Welcome back to our module on data analysis and visualization.
In the last lesson, we explored Matplotlib and learned how to create a variety of essential static plots. Static charts are excellent for reports and publications, but for the process of exploring data yourself, interactivity can be a game-changer.
This lesson builds directly on that foundation. Our goal is to master the learning outcome: Create interactive visualizations using Plotly Express. We'll move from the static world of Matplotlib to the dynamic, interactive world of Plotly. You will learn how to build charts that you can hover over for details, zoom into, and filter, making your data exploration process much more efficient and insightful.
From Static to Interactive: Why Plotly?
Matplotlib is the workhorse of Python plotting, but it was designed for creating static, publication-quality figures. Plotly, and specifically its high-level API, Plotly Express, is designed from the ground up for interactivity in web-based environments like Jupyter notebooks.
With Plotly, you can:
- Hover over data points to see their exact values.
- Zoom and pan to inspect dense areas of your plots.
- Click on legend items to toggle data series on and off.
- Create animations to see how data evolves over time.
These features make it an invaluable tool for exploratory data analysis (EDA). To get a better sense of Plotly and its place in the Python visualization ecosystem, let's start with a brief reading.
Creating Interactive Visualizations with Plotly
This article from Programming Historian provides a clear overview of the different Plotly libraries and explains the key advantages of using Plotly for creating interactive graphs.
Please read the 'Introduction' section, focusing on 'What is Plotly?' and 'Why Plotly?'. Pay special attention to the distinction between Plotly Express (px), Graph Objects (go), and Dash. We will be focusing on Plotly Express (px) in this lesson.
The Plotly Express Workflow
As you just read, Plotly Express (px) is a high-level interface that makes creating beautiful, interactive plots incredibly simple. The syntax is very similar to the pandas plotting functions you saw in the last lesson and is designed to work seamlessly with pandas DataFrames.
Python Plotly Express Tutorial: Unlock Beautiful Visualizations
Let's review the basic structure of a Plotly Express plot. This tutorial from DataCamp clearly lays out the anatomy of a plot and the simple, repeatable syntax you will use.
Read the section 'Basics of Plotly Express'. This will cover the installation (pip install --upgrade plotly), the import convention, and the fundamental code structure for creating a plot. Don't worry about the specific dataset for now; focus on the pattern: fig = px.plotting_function(...) followed by fig.show().
The general pattern is straightforward:
- Import the library:
import plotly.express as px - Import pandas to handle your data:
import pandas as pd - Load your data into a DataFrame.
- Call the appropriate
pxfunction (e.g.,px.scatter,px.bar) with your DataFrame and column names. - Call
fig.show()to display the interactive plot.
A Tour of Interactive Plots with Plotly Express
Now for the fun part. Let's create the interactive versions of the plots we learned about in the previous lesson. We'll use a comprehensive video tutorial to demonstrate the creation and interactivity of each plot type. I will provide code summaries for you to follow along.
For our examples, we will use some of the built-in datasets that come with Plotly Express, such as the tips dataset. You can load it easily:df_tips = px.data.tips()
1. Scatter Plots (px.scatter)
Just like in Matplotlib, scatter plots are used to visualize the relationship between two numerical variables. With Plotly, you can hover over each point to see the underlying data.
Let's see how to create one and add a third dimension of information using color.
This segment from a 'Plotly Tutorial' by Derek Banas demonstrates how to create a rich scatter plot. Notice how parameters like color, size, and hover_data can encode multiple variables into a single chart.
Watch from 26:02 to 28:10. The video uses the iris dataset, another built-in dataset you can load with px.data.iris(). Pay attention to the syntax and the resulting interactive plot.
Code Summary (using the tips dataset):
import plotly.express as px


# Load the built-in tips dataset
df_tips = px.data.tips()


# Create an interactive scatter plot
fig = px.scatter(df_tips,
                 x="total_bill",
                 y="tip",
                 color="smoker",      # Color points by 'smoker' column
                 size='size',       # Size points by the 'size' of the party
                 hover_data=['day'],  # Show the 'day' column on hover
                 title="Tip Amount vs. Total Bill")

fig.show()
Run this code yourself. Hover over the points and click the "smoker" and "non-smoker" items in the legend to see the interactivity in action!
2. Bar Charts (px.bar)
Bar charts are for comparing quantities across different categories. Plotly makes it easy to create simple, stacked, or grouped bar charts.
Let's see how to create bar charts. This clip shows how to create a simple bar chart and a stacked bar chart, which is great for showing part-to-whole relationships across categories.
Watch from 17:11 to 20:30. Observe how the color parameter is used to create the stacked bars, breaking down the total tip amount by the sex of the payer.
Code Summary (Grouped Bar Chart):
To create a grouped bar chart (side-by-side) instead of a stacked one, you simply add the barmode='group' argument.
import plotly.express as px
df_tips = px.data.tips()


# Create a grouped bar chart
fig = px.bar(df_tips,
             x="day",
             y="total_bill",
             color="smoker",
             barmode="group", # This creates side-by-side bars
             title="Total Bill by Day, Grouped by Smoker")

fig.show()
3. Histograms (px.histogram)
Histograms show the distribution of a single numerical variable. Plotly's histograms are interactive, allowing you to see the range and count for each bin on hover.

This segment shows how to create a histogram. It also introduces a great feature: marginal plots. You can add a violin or box plot in the margin to get even more distributional information.
Watch from 39:36 to 42:15. Notice the marginal parameter, which adds a summary plot above the main histogram.
Code Summary:
import plotly.express as px
df_tips = px.data.tips()


# Create a histogram of total_bill, with a box plot in the margin
fig = px.histogram(df_tips,
                   x="total_bill",
                   color="day",       # Create overlapping histograms for each day
                   marginal="box",    # Add a box plot to the top margin
                   title="Distribution of Total Bill Amounts by Day")

fig.show()
4. Box Plots (px.box) and Violin Plots (px.violin)
While histograms are great, box plots and violin plots are often better for comparing distributions across several categories.
- Box plots show the quartiles, median, and outliers.
- Violin plots combine a box plot with a density curve, showing the shape of the distribution.
Let's look at box plots, which are extremely useful for EDA. This clip demonstrates a simple box plot and then a grouped box plot to compare distributions across two categorical variables.
Watch from 44:22 to 47:00. See how you can compare tip distributions by 'sex' and then break it down further by 'day' using the color parameter.
Code Summary (Violin Plot with inner Box Plot):
import plotly.express as px
df_tips = px.data.tips()


# Create a violin plot to compare tip distributions by day
fig = px.violin(df_tips,
                x="day",
                y="tip",
                color="sex",
                box=True,       # Display a box plot inside the violin
                points="all",   # Show all the underlying data points
                title="Tip Distribution by Day and Sex")

fig.show()
Advanced Interactivity
Plotly Express makes it surprisingly easy to create very advanced visualizations. Let's look at two powerful features: faceting and animation.
- Faceting: Creating a grid of subplots based on a category. This is done with the
facet_coland/orfacet_rowparameters. - Animation: Creating an animation that shows how the data changes based on a variable (like time). This is done with the
animation_frameparameter.
This final video segment will showcase faceting and animation. These features can reveal complex patterns in your data that are difficult to see otherwise.
Watch two short parts: Facets (1:13:20 - 1:15:55): See how facet_col and facet_row can create a grid of plots, allowing you to compare many segments of your data at once. Animations (1:18:06 - 1:20:45): Watch how to create an animated scatter plot that shows changes over time using animation_frame. This is one of Plotly's most compelling features.
Saving and Sharing Your Plots
Once you've created a plot, you'll often want to save it. You have two main options:
- Interactive HTML file: This saves the plot as a self-contained web page, preserving all interactivity.
- Static image file (PNG, JPEG, SVG, PDF): This is for use in reports or presentations where interactivity isn't possible.
Creating Interactive Visualizations with Plotly - Programming Historian
Finally, let's learn the correct way to export your figures. This is a crucial step for sharing your work.
Read the section 'Viewing and Exporting Figures'. You will need to install an extra package (kaleido) for static image export: pip install -U kaleido.
Conclusion
Congratulations! You've taken a significant step forward in your data visualization capabilities. You've moved beyond static charts and can now build rich, interactive visualizations that make data exploration faster and more intuitive.
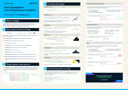
For a quick reference, here is a handy cheat sheet that summarizes the key functions in Plotly Express.
Key Takeaways:
- Plotly Express (
px) is a high-level Python library for creating interactive visualizations with simple syntax. - It integrates seamlessly with pandas DataFrames.
- You can create interactive versions of common plots:
px.scatter,px.bar,px.histogram,px.line,px.box, andpx.violin. - You can add more data dimensions using parameters like
color,size,symbol, andhover_data. - Advanced features like faceting (
facet_col) and animations (animation_frame) can reveal complex patterns. - Plots can be saved as interactive HTML files (
fig.write_html()) or static images (fig.write_image()).
In our next lesson, we will put everything from this module together. You will learn how to perform exploratory data analysis and document key findings. The skills you've gained in data wrangling with pandas and visualization with both Matplotlib and Plotly will be the core tools you use to investigate a dataset from start to finish.