Hello! Welcome to the final lesson of our "Data Analysis and Visualization" module, where we bring everything together.
In our previous lessons, you've built a strong toolkit. You've learned to load, clean, and wrangle data with pandas. You've mastered creating static plots with Matplotlib and, most recently, powerful interactive visualizations with Plotly Express.
Today, we'll use all those skills to achieve a crucial learning outcome for any data professional: Perform exploratory data analysis and document key findings. We will move beyond individual tasks and learn the systematic process of exploring a dataset from start to finish to uncover its secrets.
What is Exploratory Data Analysis (EDA)?
Think of EDA as the detective work of data science. Before you can build a sophisticated AI model or draw definitive conclusions, you must first understand your data intimately. EDA is the process of using summary statistics and visualizations to investigate a dataset, understand its structure, identify anomalies, and discover patterns.
To get a formal understanding, let's start with a short reading that defines EDA and outlines its importance.
A Beginner's Guide to Exploratory Data Analysis (EDA) with Real ...
This article from devbysatyam on Medium provides a great introduction to the 'what' and 'why' of EDA. It clearly explains the purpose and benefits of this critical first step in any data project.
Please read the 'Introduction', 'What is Exploratory Data Analysis?', and 'Why is EDA Important?' sections. Focus on the goals of EDA, such as understanding structure, identifying patterns, and guiding preprocessing decisions.
The core goals of EDA, as you just read, are to:
- Assess data quality: Find missing values, errors, and inconsistencies.
- Understand your variables: Analyze their distributions, ranges, and central tendencies.
- Detect relationships and patterns: Uncover correlations, clusters, and trends between variables.
- Formulate hypotheses: Generate questions that can be tested with more formal statistical methods.
The EDA Workflow: A Systematic Approach
While EDA is an open-ended exploration, it's not a random walk. Following a systematic process ensures you cover all the essential bases. This flowchart provides a high-level overview of the typical steps.
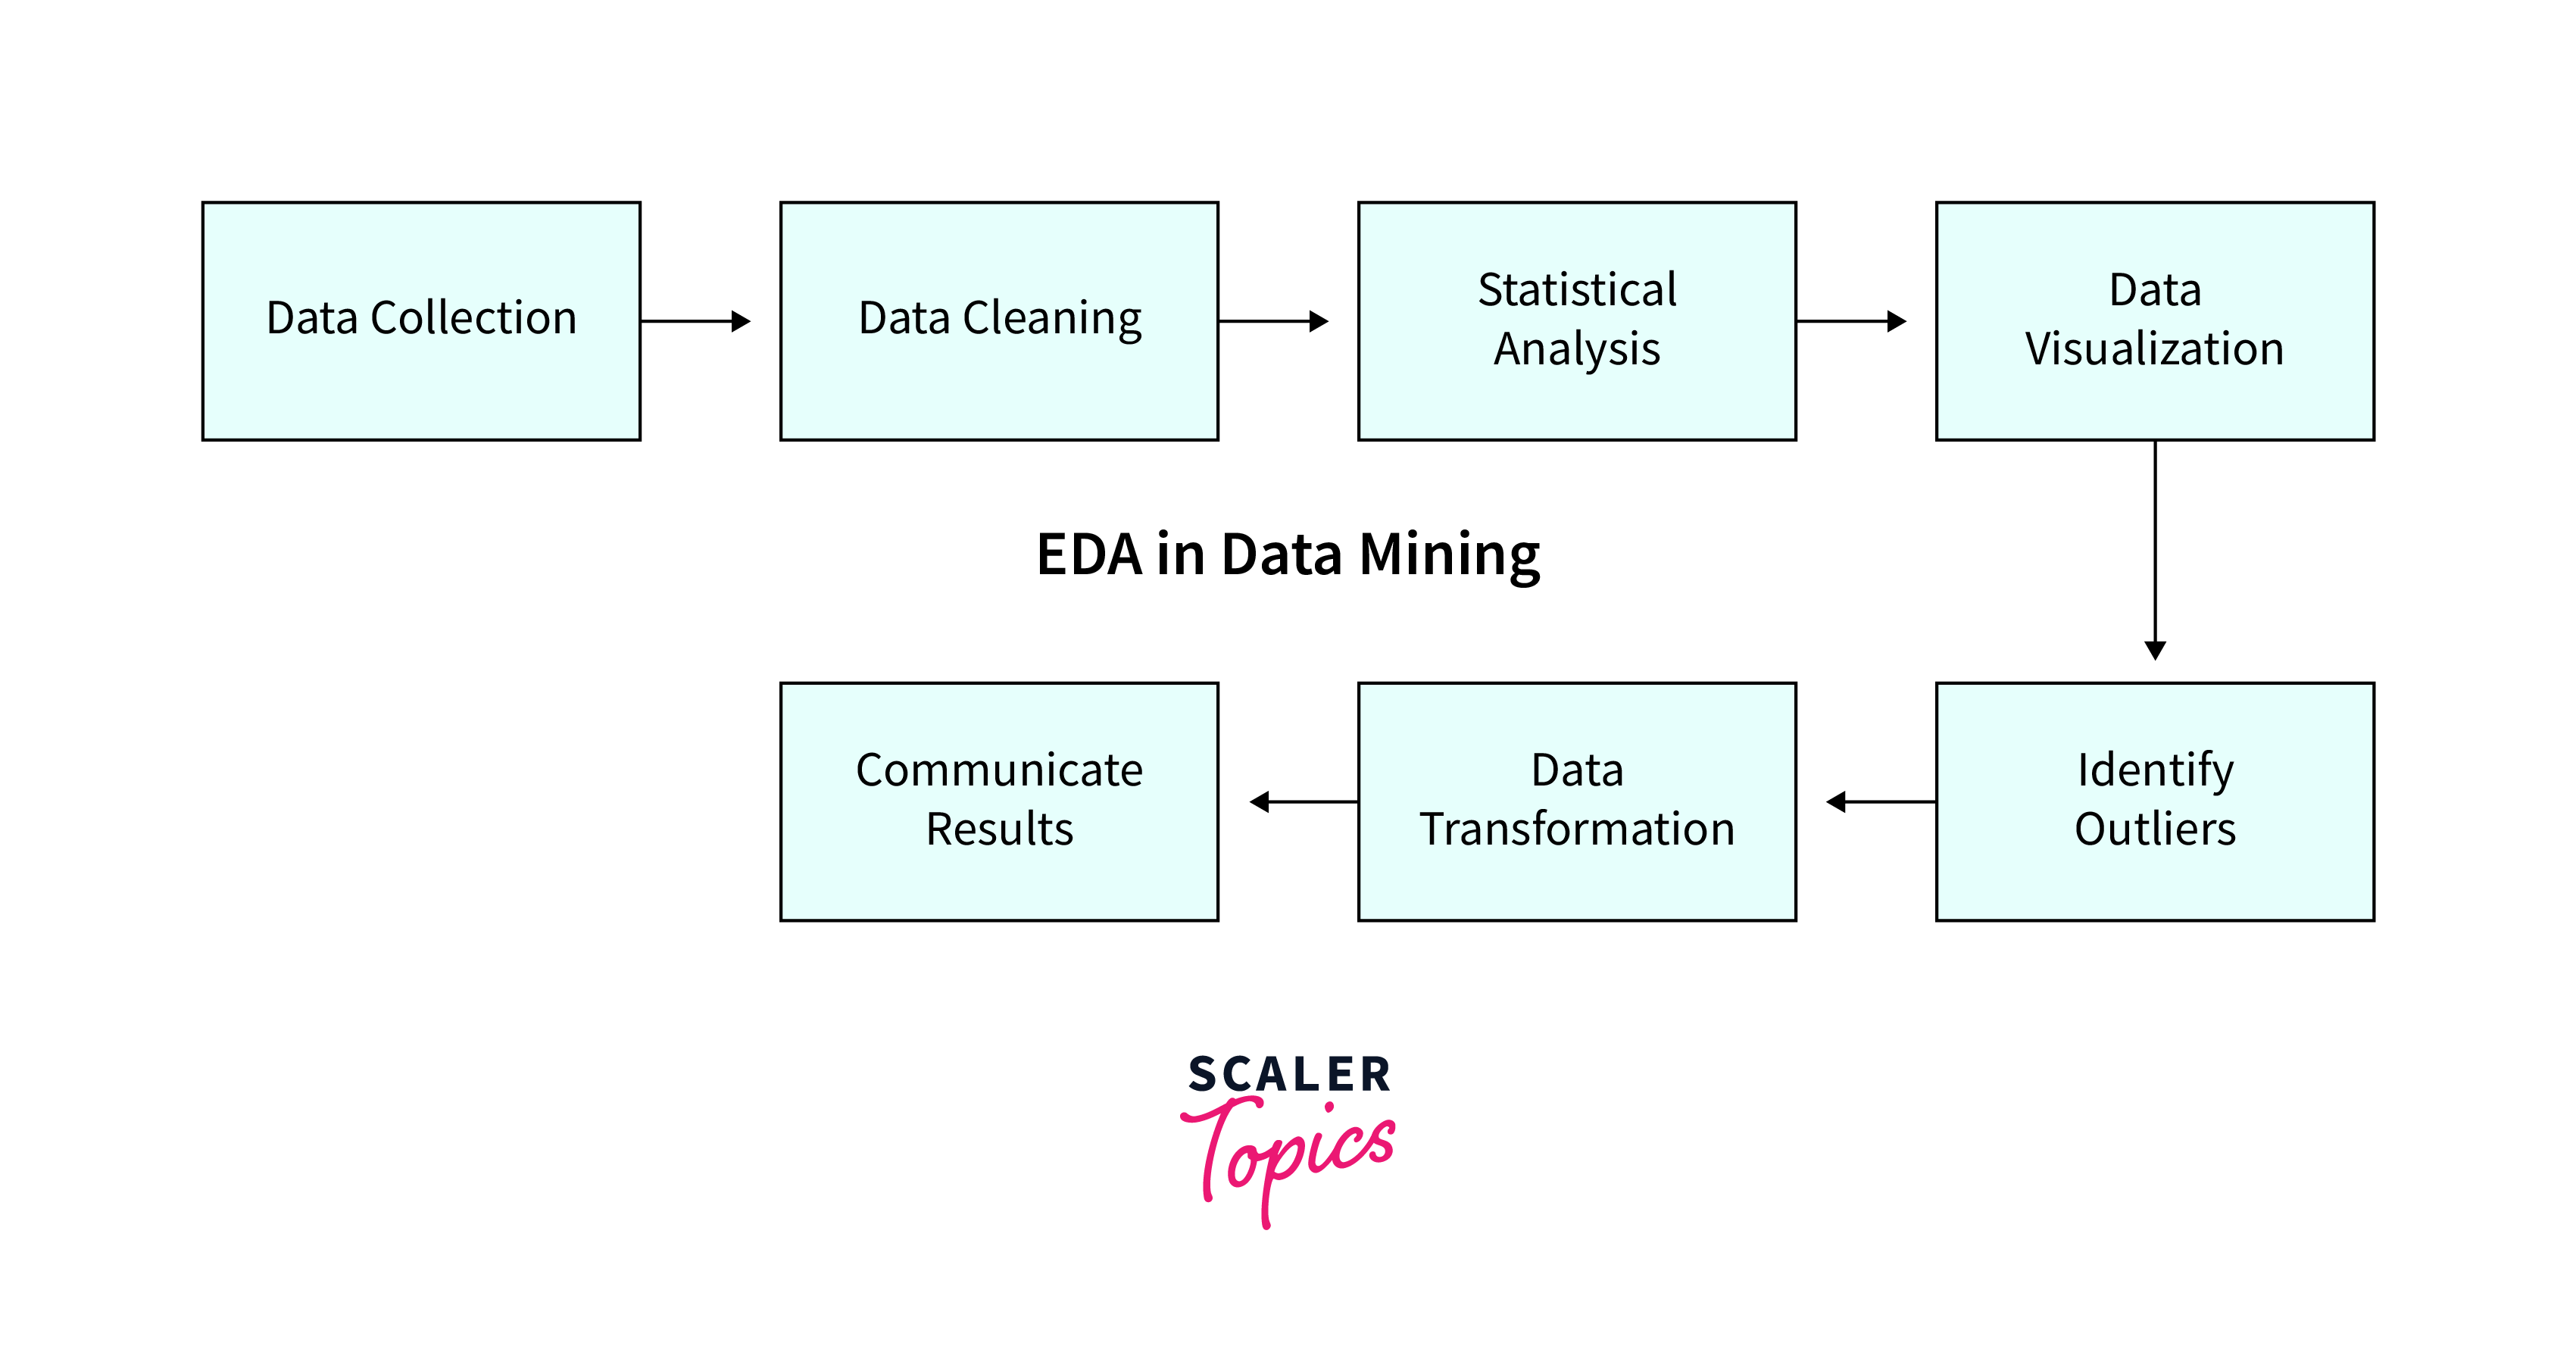
We are going to follow a very similar process in a practical, end-to-end walkthrough. The following video by Rob Mulla is an excellent, real-world demonstration of conducting EDA on a dataset of roller coasters. It beautifully ties together all the pandas and visualization skills you've acquired.
We will watch it in segments, pausing to reflect on each step.
Step 1: Data Understanding and Preparation
This initial phase is about loading the data and getting it into a clean, usable state. This involves two sub-steps: a quick overview to understand the data's basic characteristics, followed by more detailed preparation and cleaning.
Exploratory Data Analysis with Pandas Python
Let's start with the first phase: understanding and preparing the data. This corresponds to the 'Data Collection' and 'Data Cleaning' steps in the flowchart.
Please watch the following two segments: Data Understanding (3:29 - 6:38): Pay attention to the initial pandas commands used: .shape, .head(), .columns, .dtypes, and .describe(). These give you a quick first impression of the dataset. Data Preparation (6:38 - 20:57): Observe the systematic cleaning process. This includes subsetting columns, renaming them for clarity, converting data types (e.g., to datetime), identifying and counting missing values (.isna().sum()), and detecting and removing duplicate rows (.duplicated(), .drop_duplicates()).
This first phase is a practical application of our first few lessons in this module. You're taking a raw dataset and, through a series of logical steps, preparing it for meaningful analysis.
Step 2: Univariate Analysis
Once the data is clean, we can start the analysis. We begin by looking at each variable individually. This is called univariate analysis. The goal is to understand the distribution of each feature.
Exploratory Data Analysis with Pandas Python
Now, let's analyze single variables. This will help us understand their individual characteristics.
Watch from 20:57 to 27:44. Notice how different techniques are used for different data types: For categorical-like numerical data ('year_introduced'), .value_counts() and bar plots are used. For continuous numerical data ('speed_mph'), histograms (.plot(kind='hist')) and Kernel Density Estimate (KDE) plots are used to visualize the distribution.
This step is where your visualization skills from the Matplotlib and Plotly lessons come into play. A simple histogram or bar chart can immediately reveal if a variable is skewed, has multiple peaks (bimodal), or contains potential outliers.
Step 3: Bivariate and Multivariate Analysis
Now that we understand individual variables, we look at the relationships between them.
- Bivariate analysis examines pairs of variables.
- Multivariate analysis looks at three or more variables simultaneously.
Exploratory Data Analysis with Pandas Python
Let's explore how different features relate to each other. This is often where the most interesting insights are found.
Watch from 27:44 to 35:14. This section showcases several powerful techniques: Scatter plots to see the relationship between two numeric variables (e.g., speed vs. height). Using the hue parameter (in Seaborn, similar to color in Plotly Express) to add a third variable to a scatter plot. Pair plots to quickly visualize the relationships between all pairs of numeric variables in a grid. Correlation heatmaps to quantify the linear relationships between variables.
These visualizations help you answer questions like:
- Do faster roller coasters tend to be taller? (Scatter plot)
- How do speed, height, and length all relate to each other? (Pair plot)
- Which numeric features are most strongly correlated? (Heatmap)
Step 4: Asking and Answering Questions
The ultimate goal of EDA is not just to create plots but to generate and answer questions about the data. The exploration should be guided by curiosity. After you have a feel for the data, you can formulate specific questions and use your pandas and visualization skills to find the answers.
Exploratory Data Analysis with Pandas Python
This final segment demonstrates the culmination of the EDA process: using the tools to answer a specific, interesting question about the data.
Watch from 35:14 to 39:32. The question posed is: 'What are the locations with the fastest roller coasters (with a minimum of 10 coasters)?' Notice the chain of operations used to answer this: Filtering out irrelevant data (.query()) Grouping by location (.groupby()) Aggregating to calculate mean speed and count (.agg(['mean', 'count'])) Filtering the result based on the count Sorting the final list (.sort_values()) Plotting the result to present the answer clearly.
This step perfectly demonstrates how you can combine data wrangling (groupby, agg) and visualization to produce a clear answer to a complex question.
Documenting Your Findings
An analysis that lives only in your head is incomplete. A crucial part of EDA is documenting your process and findings. As you work through a dataset in a Jupyter notebook, you should use Markdown cells to narrate your analysis.
Best Practices for Documentation:
- State your intentions: Before a block of code, write a sentence or two about what you are trying to do. (e.g., "Next, I will check for missing values in the dataset.")
- Summarize your findings: After generating a plot or a statistical summary, write down what you observe. (e.g., "The histogram of 'Age' is right-skewed, suggesting that most passengers are young adults. There are very few elderly passengers.")
- Use clear visualizations: Always give your plots descriptive titles and label your axes. The plot should be understandable even without the surrounding code.
- Conclude with key insights: At the end of your notebook, create a summary section that lists the most important findings from your analysis.
For a great example of what a final summary of findings looks like, let's refer back to the article on the Titanic dataset.
A Beginner's Guide to Exploratory Data Analysis (EDA) with Real ...
This article concludes its analysis with a concise summary of the key takeaways. This is a model for how you should document your own EDA conclusions.
Read the section 'Key Findings from Our Analysis'. Notice how it presents clear, actionable statements derived from the data exploration.
Conclusion
You have now learned the complete, end-to-end workflow for Exploratory Data Analysis. This is a fundamental skill that synthesizes everything you've learned in this module, from data loading and cleaning with pandas to creating insightful visualizations with Matplotlib and Plotly.
Key Takeaways:
- EDA is a structured process: It involves understanding, preparing, and analyzing data systematically.
- The workflow is iterative: You might discover something in bivariate analysis that sends you back to clean or transform a variable.
- Analysis moves from simple to complex: Start with individual variables (univariate), then pairs (bivariate), and then multiple variables (multivariate).
- EDA is question-driven: Use your tools to answer specific questions and test hypotheses you form along the way.
- Documentation is critical: Your analysis is only as valuable as your ability to communicate it. Narrate your process and summarize your key findings.
In our next and final lesson of this module, we will focus on the last step of the EDA flowchart: Interpret distributions and relationships between variables. We will go deeper into the statistical concepts behind the patterns you've learned to visualize, helping you add more robust interpretations to your findings.