Introduction
Welcome to our next lesson in the "Foundations of Research in Swasthawritta" module. In our previous session, we established a clear framework for selecting the appropriate statistical test—like a t-test or chi-square test—based on your research question and the nature of your data. This was about choosing the right diagnostic tool. Today, we focus on interpreting the results that tool provides.
This lesson directly addresses the learning outcome: Interpret p-values and confidence intervals from research papers to draw conclusions about study hypotheses. Understanding these two concepts is the cornerstone of evidence-based practice. It allows you to move beyond simply reading the author's conclusions in a research paper to critically assessing the statistical evidence yourself. This is an essential skill for evaluating the efficacy of any Swasthawritta intervention, from a Dinacharya practice to a specific herbal formulation.
1. The p-Value: Quantifying Surprise
When we conduct a study, we start with a default assumption called the null hypothesis (). This hypothesis states that there is no effect or no difference between the groups being compared. For example, in a trial comparing a new Ayurvedic formulation to a placebo for improving sleep quality, the null hypothesis would be that the formulation has no effect on sleep quality.
The p-value is a probability that helps us decide whether to stick with this null hypothesis or reject it in favor of an alternative hypothesis (), which states that there is an effect.
To get a clear and intuitive understanding of what a p-value is and how it's used, let's start with a short video.
p-values: What they are and how to interpret them
This video from StatQuest with Josh Starmer provides one of the clearest explanations available on p-values. It explains what they represent, how the common 0.05 threshold is used, and what it means in terms of potential errors.
Please watch from 04:17 to 09:41. Pay close attention to the definition of the p-value, the explanation of the 0.05 threshold, the concept of a 'false positive,' and the introduction to the 'null hypothesis'.
Key Concepts from the Video
- Definition: The p-value is a number between 0 and 1. It measures how compatible your data are with the null hypothesis. A small p-value indicates that your observed data are surprising, or unlikely, if the null hypothesis were true.
- The Significance Threshold (): In most medical research, a threshold (called alpha, ) is set at 0.05.
- If p ≤ 0.05, we reject the null hypothesis. We conclude that the result is statistically significant, meaning the observed difference is unlikely to be due to random chance alone.
- If p > 0.05, we fail to reject the null hypothesis. The result is not statistically significant. We don't have enough evidence to say the observed difference wasn't just due to chance.
- Important Nuance: Failing to reject the null hypothesis does not prove that it's true. It simply means we lack sufficient evidence to say it's false. This is like a court verdict of "not proven guilty" rather than "innocent."
2. The Critical Limitation of the p-Value
The p-value tells you whether an effect is likely to be real (i.e., not due to chance), but it tells you nothing about the size or the clinical importance of that effect. This is a point of paramount importance for clinicians.
Let's continue with the StatQuest video, which makes this exact point.
p-values: What they are and how to interpret them
This final segment of the video highlights the single most important limitation of p-values that you must understand as a clinician.
Please watch from 09:41 to 11:02. Focus on the distinction between a 'statistically significant' p-value and the 'effect size' or the magnitude of the difference.
A study with a very large sample size can find a tiny, clinically meaningless difference to be "statistically significant" (e.g., a weight loss drug that leads to an average loss of 200g over a year might have p < 0.001 but is clinically useless).
This is why we need a more informative measure: the Confidence Interval.
3. The Confidence Interval (CI): A Range of Plausible Values
A Confidence Interval gives us a range of values within which the true effect in the population likely lies. It provides two crucial pieces of information that the p-value alone does not: the magnitude of the effect and the precision of the estimate.
- Magnitude: The numbers in the interval tell you how large or small the effect might be (e.g., a 2 to 10 kg weight loss).
- Precision: The width of the interval tells you how certain we are about the effect. A narrow CI (e.g., 5 to 6 kg weight loss) means we have a precise estimate. A wide CI (e.g., 1 to 20 kg weight loss) indicates a lot of uncertainty.
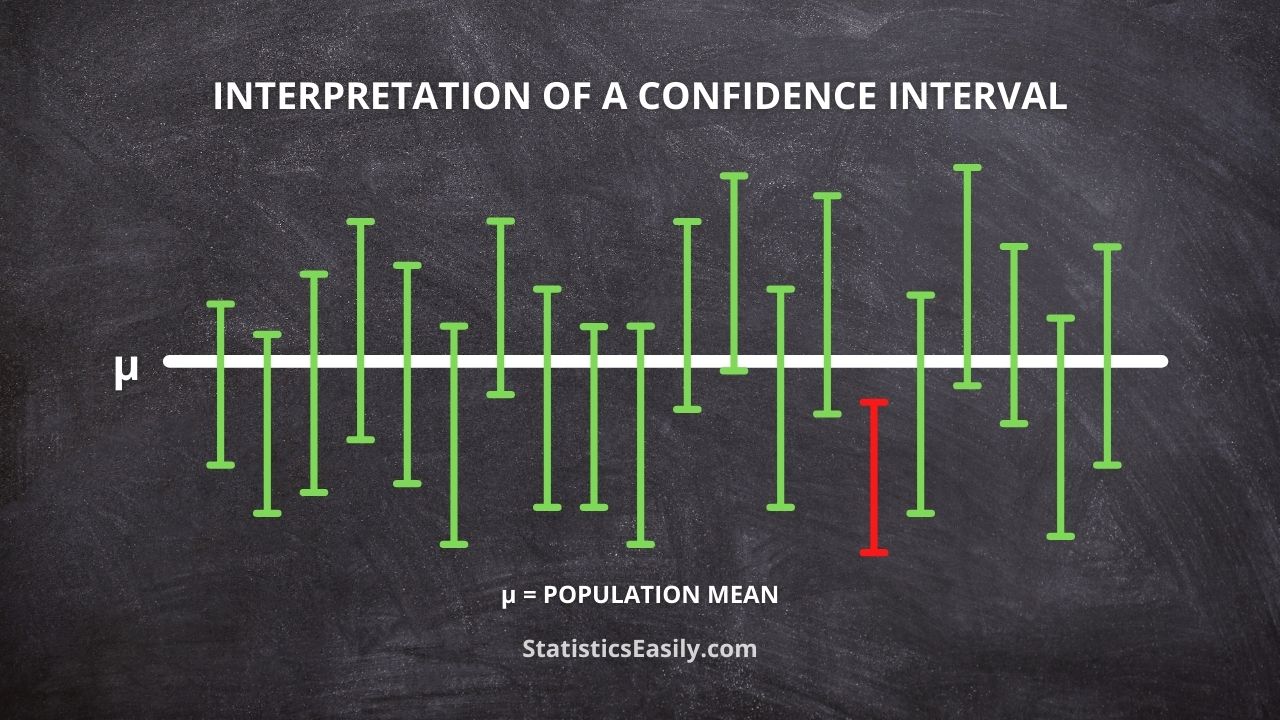
Interpreting the CI in Practice
The most common CI is the 95% CI, which is mathematically linked to the p-value threshold of 0.05. Here’s how to use it to assess statistical significance:
- For comparisons of means (e.g., t-test): The null hypothesis is a difference of zero. If the 95% CI for the difference between two groups includes the value 0, the result is not statistically significant (p > 0.05).
- For ratios (e.g., Risk Ratio, Odds Ratio): The null hypothesis is a ratio of 1.0 (meaning equal risk in both groups). If the 95% CI for the ratio includes the value 1.0, the result is not statistically significant (p > 0.05).
To dive deeper into this and solidify the distinction between statistical and clinical relevance, the following article is an essential read for clinicians.
Interpreting “statistical hypothesis testing” results in clinical ...
The paper 'Interpreting “statistical hypothesis testing” results in clinical research' is written specifically for medical professionals. It clearly explains the pitfalls of relying only on p-values and emphasizes the importance of clinical judgment.
Please read the section 'On making sense of data and/or results.' It begins after the introduction and continues for several paragraphs. Pay special attention to the examples given to illustrate: How CIs are calculated and interpreted (the surgeon with 0 complications). The critical difference between statistical significance and clinical significance (the sore throat and tranquilizer examples).
4. Integrating Statistical and Clinical Significance
Now, let's combine these concepts. When you read a study, you must ask two questions:
- Is the result statistically significant? (Look at the p-value or whether the CI crosses the null value).
- If so, is the result clinically significant? (Look at the values within the CI and use your clinical judgment to decide if the effect size is meaningful).
This image provides a powerful visual framework for this dual assessment. It introduces a "range of clinical indifference"—a range of effects that you would consider too small to be clinically meaningful.
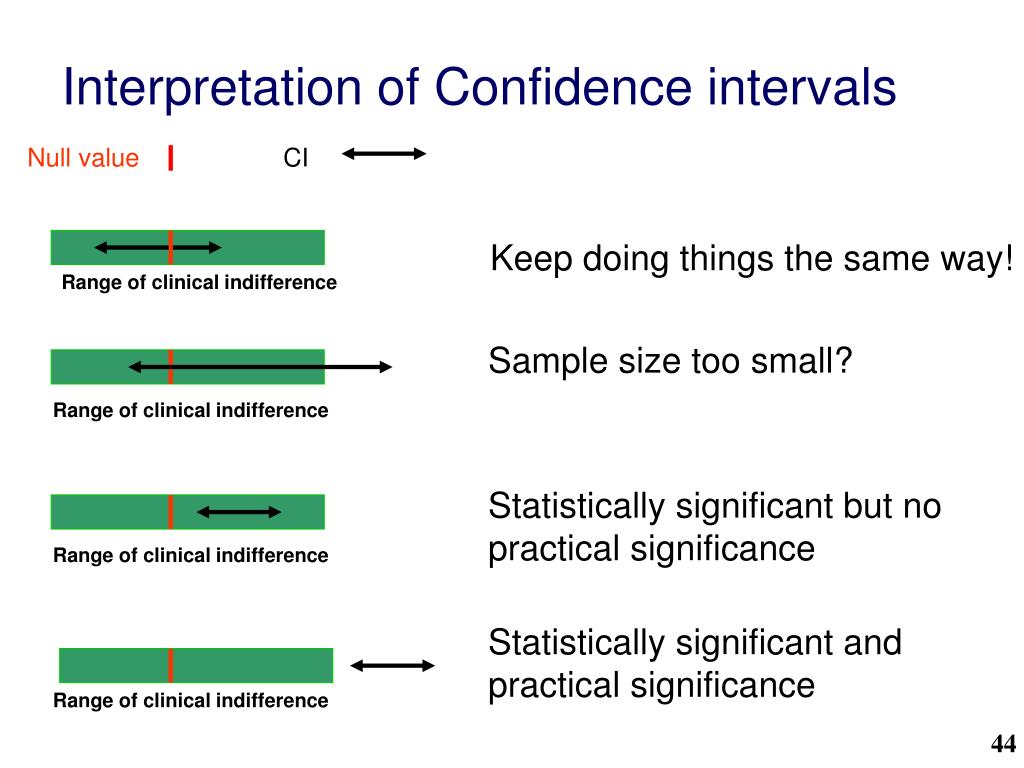
Let's analyze the four scenarios in a Swasthawritta context, imagining a study on an intervention to reduce systolic blood pressure (SBP):
- Scenario A: The CI includes 0 (the null value). The result is not statistically significant. We don't have enough evidence to conclude the intervention works.
- Scenario B: The entire CI is on the beneficial side of 0, but it falls entirely within the "range of clinical indifference" (e.g., the CI for SBP reduction is 0.5 to 1.5 mmHg). The result is statistically significant, but not clinically significant. The effect is real, but too small to matter.
- Scenario C: The CI includes 0, so the result is not statistically significant. However, the CI is very wide and includes clinically important values (e.g., a reduction of 15 mmHg). This suggests the study was underpowered (too small) and inconclusive. We can't rule out a clinically important benefit.
- Scenario D: The entire CI is on the beneficial side of 0 and also falls outside the range of clinical indifference (e.g., the CI for SBP reduction is 5 to 15 mmHg). This is the ideal result: both statistically and clinically significant.
Test your understanding!
A randomized trial investigates the effect of a specific Pranayama technique on anxiety, measured with the GAD-7 scale (scores range 0-21). After 8 weeks, the mean difference in GAD-7 score between the Pranayama group and a control group was -3.5 points. The results were reported as: (95% CI: -6.0 to -1.0; p=0.008).
Based on this, answer the following:
- Is the result statistically significant? Why?
- What is the range of plausible true effects for this Pranayama technique?
- As a clinician, how would you interpret the clinical importance of this finding?
Show answer
- Yes, the result is statistically significant. There are two reasons: the p-value (0.008) is less than 0.05, and the 95% Confidence Interval (-6.0 to -1.0) does not contain the null value of 0.
- The range of plausible true effects is a reduction in the GAD-7 score of anywhere between 1.0 and 6.0 points. The best estimate from the study is a reduction of 3.5 points.
- The finding appears clinically important. A reduction of at least 1 point is guaranteed with 95% confidence, and the reduction could be as large as 6 points. In the context of the GAD-7 scale, a change of 3-4 points is generally considered clinically meaningful. The effect is not only statistically real but also appears large enough to make a noticeable difference for a patient.
5. Advanced Interpretation: The "Compatibility" Approach
As you've seen, relying on a strict p<0.05 cutoff can be misleading. Many leading statisticians now advocate for a more nuanced approach, reframing p-values and CIs as measures of compatibility.
This perspective encourages you to think about which effect sizes are most compatible with your data, rather than making a simple yes/no decision.
p-Values and confidence intervals as compatibility measures
This commentary in The Lancet, 'p-Values and confidence intervals as compatibility measures,' argues for a more thoughtful interpretation of statistics that aligns better with clinical judgment. This will give you a deeper, more sophisticated understanding.
Read from the paragraph starting 'A statistical test involves...' up to the paragraph ending '...reducing post-hoc interpretations.' Focus on how the authors redefine a 'confidence' interval as a 'compatibility' interval and how this reframing leads to more cautious and clinically relevant conclusions in their examples.
The key idea is that a 95% CI simply shows you all the possible effect sizes that are reasonably compatible with your data (i.e., all the hypotheses that would give p > 0.05). This moves you away from black-and-white thinking and towards a more holistic assessment of the evidence.
6. Application: Interpreting a Real Clinical Trial
Let's finish by seeing how these concepts are applied in the complex world of a real clinical trial analysis. The following video discusses several landmark trials, and the speaker's thought process is highly instructive.
How to interpret clinical trial data – Examples from recent clinical trials
In this video from the European Society of Cardiology, a cardiologist walks through the interpretation of several major clinical trials. This is an excellent example of a clinician applying the principles we've discussed to complex data.
You don't need to understand the specifics of the drugs. Focus on how the speaker interprets the statistics. Watch from 03:37 to 06:10. Note how he discusses the 6% risk reduction (the effect size) and NNT of 50, asking what it means clinically, even though it was statistically significant. Watch from 08:30 to 11:23. Pay close attention to the concept of 'p for interaction' in subgroup analysis. This is crucial for deciding if an intervention works better in one subgroup (e.g., diabetics) than another. Watch from 25:57 to 28:33. This is a fascinating example where a 50% risk reduction was not statistically significant (p=0.08) because the study was small. It perfectly illustrates the danger of concluding 'no effect' from a non-significant p-value in an underpowered study.
Conclusion
In this lesson, we have demystified the core statistical outputs you will encounter when reading research. We have moved from a simplistic view of p-values to a more robust, clinically-oriented interpretation that integrates effect size and precision through confidence intervals.
Key Takeaways:
- The p-value tells you the probability of seeing your data (or more extreme data) if there were truly no effect. A small p-value (typically ≤ 0.05) suggests the effect is unlikely to be due to chance.
- The p-value does not measure the size or importance of an effect.
- The 95% Confidence Interval (CI) provides a range of plausible values for the true effect size in the population. It communicates both the magnitude and precision of the finding.
- The most critical task for a clinician is to distinguish statistical significance (Is the effect real?) from clinical significance (Is the effect large enough to matter?). Use the CI to make this judgment.
- Thinking in terms of compatibility rather than a simple significant/non-significant dichotomy leads to more nuanced and appropriate clinical conclusions.
Preview of the Next Lesson:
Now that you can interpret the statistical heart of a research paper, you are ready for the next step: systematically appraising the entire study for its quality. A result can be statistically significant, but if the study was poorly designed or conducted, the finding may be invalid due to bias. In our next lesson, "Select and apply a structured critical appraisal tool (e.g., CASP checklist) to a research article on a Swasthawritta practice," we will learn how to formally assess a study's validity.