Introduction
Welcome back to our module on research foundations in Swasthawritta. In our last lesson, we established the crucial difference between descriptive statistics, which summarize our sample data, and inferential statistics, which allow us to make broader conclusions about the population. We learned that inferential tests are the tools we use to formally test our research hypotheses.
This naturally leads to a practical question: with so many different statistical tests available, how do we select the correct one for our study? Making the right choice is fundamental to generating valid and meaningful results.
This lesson will directly address the learning outcome: Choose appropriate basic statistical tests (e.g., t-test, chi-square) to compare groups based on the type of data collected. We will build a systematic framework for this decision-making process, focusing on three key questions:
- What is the nature of your data (your variables)?
- How many groups are you comparing?
- Are your groups independent or related?
By the end of this lesson, you will be able to look at a research scenario and confidently identify the appropriate statistical tool to analyze the data.
1. The Core Decision: Understanding Your Variables
The most critical factor in choosing a statistical test is the type of variable you are measuring. In our previous lesson, we touched on this, but let's formalize the definitions.
Comprehensive guidelines for appropriate statistical ...
The following paper, 'Comprehensive guidelines for appropriate statistical analysis,' provides clear and formal definitions of variable types. Understanding this is the first and most important step in our decision framework.
Please read the section titled 'Types of variables.' It begins with 'As the word suggests, a variable is a “changeable number.”' and ends just before 'Statistical analysis methods and hypotheses.' Focus on the distinction between categorical (nominal, ordinal) and quantitative (continuous, discrete) variables.
To place these definitions in an Ayurvedic research context:
-
Quantitative (Continuous) Variables: These are numerical measurements that can take any value within a range.
- Examples: Hemoglobin level (e.g., 12.5 g/dL), blood pressure (e.g., 120/80 mmHg), weight (e.g., 65.7 kg), a Visual Analogue Scale (VAS) score for pain from 0-100.
-
Categorical Variables: These represent groups or categories.
- Nominal: Categories with no inherent order.
- Examples: Prakruti (Vata, Pitta, Kapha), Gender (Male, Female), Treatment group (Ayurvedic, Control).
- Ordinal: Categories with a clear, meaningful order.
- Examples: Disease severity (Mild, Moderate, Severe), Bala (Avara, Madhyama, Pravara), satisfaction rating (Poor, Fair, Good, Excellent).
- Nominal: Categories with no inherent order.
This distinction is the root of our decision tree. Now let's look at that tree.
2. A Visual Guide for Choosing a Test
Navigating statistical tests can seem complex, but a flowchart can simplify the process immensely. The flowchart below maps out the decisions based on your research question and variable types. For this lesson, we are focusing on the left side of the chart: "Comparison the difference between groups."
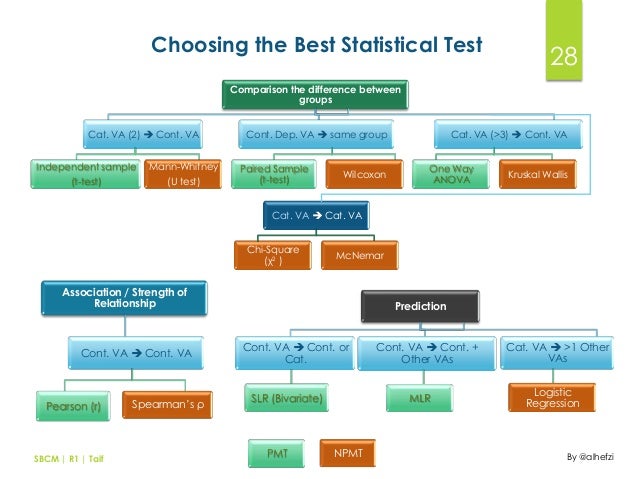
As you can see, after establishing that you want to compare groups, the next questions are:
- Is your outcome variable (the one you are measuring) continuous or categorical?
- Are your groups independent (e.g., a drug group vs. a placebo group) or paired/dependent (e.g., measurements on the same people before and after an intervention)?
- How many groups are you comparing?
Let's use this framework to explore the most common tests.
3. Key Tests for Comparing Groups
This video provides an excellent overview of the entire selection process. We will refer to it as we discuss the specific tests.
How to choose an appropriate statistical test
The video 'How to choose an appropriate statistical test' by TileStats systematically explains how to select a test based on your research question, data type, and study design. It covers all the tests we will discuss.
We will break this down. For now, watch from the beginning until 05:04. This will cover the foundational concepts we've discussed: comparing groups vs. relationships, scales of data, parametric vs. non-parametric tests, and paired vs. unpaired designs.
A. Comparing a Continuous Outcome (e.g., BMI, Blood Sugar, Pain Score)
This is a very common scenario in clinical research. For example, you want to see if an intervention changes a measurable physiological parameter.
| Number of Groups | Group Relationship | Parametric Test (Assumes Normal Distribution) | Non-Parametric Test (No Normality Assumption) |
|---|---|---|---|
| Two | Independent | Independent Samples t-test | Mann-Whitney U test |
| Two | Paired | Paired t-test | Wilcoxon Signed-Rank test |
| Three or More | Independent | One-Way ANOVA | Kruskal-Wallis test |
| Three or More | Paired | Repeated-Measures ANOVA | Friedman test |
The TileStats video you started watching covers these tests clearly.
How to choose an appropriate statistical test
Now, let's focus on the specific tests for comparing continuous or ordinal data. This section of the video will detail the tests mentioned in the table above.
Continue watching from 08:12 to 10:28. The video will walk you through the flowchart for choosing between a t-test, ANOVA, and their non-parametric equivalents.
- t-tests are for comparing the means of two groups.
- ANOVA (Analysis of Variance) is for comparing the means of three or more groups.
- Non-parametric tests (Mann-Whitney, Wilcoxon, Kruskal-Wallis) are used when your data is not normally distributed or when you have ordinal data. They compare medians or ranks instead of means.
B. Comparing a Categorical Outcome (e.g., Improved: Yes/No)
What if your outcome isn't a measurement but a count? For example, you want to compare the number of patients who reported symptom relief in a treatment group versus a control group.
For this, we use the Chi-Square () Test.
The chi-square test is used to determine if there is a significant association between two categorical variables. It compares the observed frequencies in your sample to the frequencies that would be expected if there were no relationship between the variables.
The following video provides an excellent clinical example of when to choose the chi-square test.
USMLE Step 1 | How to Choose the Correct Statistical Test
This video from MedSchoolCoach walks through a clinical problem, demonstrating the process of elimination to arrive at the correct test. It highlights the key signal for using a chi-square test.
Watch the entire video (about 7 minutes). The presenter analyzes a scenario with a categorical outcome (nausea rated as mild, moderate, or severe) and explains why tests like ANOVA and t-test are inappropriate, leaving the Chi-Square test as the correct choice. Note the mnemonic: 'Kai for categorical.'
When to use the Chi-Square test:
- Your independent variable is categorical (e.g., Treatment Group vs. Control Group).
- Your outcome variable is also categorical (e.g., Responded vs. Did Not Respond; Prakruti type).
If your sample size is very small, a variation called Fisher's Exact Test is used instead of the chi-square test.
4. Case Study: Statistical Choices in an Ayurvedic Clinical Trial
Theory is essential, but seeing it applied in practice is what solidifies understanding. Let's analyze a real Ayurvedic clinical trial. This study compares an Ayurvedic formulation (Abhraloha) with a standard modern treatment (Ferrous Ascorbate) for Iron Deficiency Anemia (Pandu).
An Evaluation of the Efficacy, Safety, and Tolerability ...
This paper provides a perfect real-world example of researchers selecting different statistical tests for different types of data within the same study.
Read the 'Materials and methods' section and the paragraph on 'Statistical analysis'. The authors explicitly state which tests they used for different comparisons. Pay close attention to how they distinguish between between-group and within-group analyses, and between continuous and categorical data.
Let's dissect their choices based on what we've learned:
-
Question: How did they compare the final hemoglobin (Hb) levels between the Abhraloha group and the Ferrous Ascorbate group?
- Outcome Variable: Hb level (continuous).
- Groups: Two independent groups.
- Appropriate Test: Independent t-test or Mann-Whitney U test.
- What they did: They used the Mann-Whitney U test. This tells us their data likely wasn't normally distributed, so they chose the correct non-parametric option.
-
Question: How did they assess if Hb levels significantly increased from baseline to the final visit within the Abhraloha group?
- Outcome Variable: Hb level (continuous).
- Groups: Two paired measurements (baseline vs. final) on one group.
- Appropriate Test: Paired t-test or Wilcoxon Signed-Rank test.
- What they did: They used the Wilcoxon signed-rank test for within-group analysis.
-
Question: How did they compare the number of patients reporting subjective improvement (a categorical variable) between the two groups?
- Outcome Variable: Improvement Yes/No (categorical).
- Groups: Two independent groups.
- Appropriate Test: Chi-square test or Fisher's exact test.
- What they did: They used the chi-square test, and noted that Fisher's exact test would be used if cell counts were too low.
This study perfectly illustrates the decision-making process in action.
Test your understanding!
For each of the following Swasthawritta research scenarios, identify the most appropriate statistical test to compare the groups.
- A study wants to determine if there is a difference in the mean BMI (a continuous variable) among three independent groups of people with Vata, Pitta, and Kapha Prakruti.
- Researchers are testing a new herbal tea for insomnia. They measure the sleep duration (in hours, a continuous variable) of 25 participants for one week before they start drinking the tea and for one week after. They want to see if the mean sleep duration changed.
- A public health survey asks 500 people if they practice Yoga (Yes/No). The researchers want to see if the proportion of people who practice Yoga is different between males and females.
Show answer
- One-Way ANOVA (or its non-parametric equivalent, the Kruskal-Wallis test). This is correct because the outcome (BMI) is continuous, and you are comparing the means of three independent groups.
- Paired t-test (or its non-parametric equivalent, the Wilcoxon Signed-Rank test). This is correct because the outcome (sleep duration) is continuous, and you are comparing two related (paired) measurements from the same group of people (before and after).
- Chi-Square () Test. This is correct because both variables are categorical: the group variable is Gender (Male/Female), and the outcome variable is Yoga practice (Yes/No). The test will check for an association between gender and the practice of yoga.
Conclusion
In this lesson, we have constructed a practical framework for selecting the correct basic statistical test for comparing groups. We learned that this critical decision is not arbitrary but is guided by a logical assessment of your research design and data.
Key Takeaways:
- The choice of a statistical test depends primarily on the type of your outcome variable (continuous vs. categorical), the number of groups being compared, and whether the groups are independent or paired.
- For comparing continuous outcomes between two groups, use a t-test. If the groups are independent, use an independent samples t-test; if they are paired (e.g., before/after), use a paired t-test.
- For comparing continuous outcomes among three or more independent groups, use One-Way ANOVA.
- For comparing categorical outcomes (i.e., frequencies or proportions), use the Chi-Square () test.
- Every parametric test (t-test, ANOVA) has a non-parametric counterpart (Mann-Whitney U, Wilcoxon, Kruskal-Wallis) to be used when the data does not meet certain assumptions like normality.
Preview of the Next Lesson:
Now that you can select the right tool for the job, the next logical step is to understand the output it produces. In our next lesson, we will focus on the learning outcome: "Interpret p-values and confidence intervals from research papers to draw conclusions about study hypotheses." We will delve into what these crucial numbers mean and how to use them to decide whether your Swasthawritta intervention had a statistically significant effect.