Introduction
Welcome back to our module on the foundations of research in Swasthawritta. In our last lesson, we focused on the crucial first step of any study: selecting high-quality assessment tools by evaluating their reliability and validity. We learned that for our data to be meaningful, the instruments we use to collect it must be both consistent and accurate.
Now, imagine you have successfully conducted a study. You've used a validated questionnaire to measure the impact of a Dinacharya protocol on the quality of life of 100 participants. You are now sitting with a spreadsheet full of numbers. What's next? How do you transform this raw data into meaningful insights? This is where the science of statistics comes in.
This lesson addresses the learning outcome: Differentiate between descriptive and inferential statistics and explain their roles in analyzing intervention data. We will explore the two major branches of statistics, understanding how they work together to first describe the data you've collected and then to draw broader conclusions about the effectiveness of your Swasthawritta intervention.
1. The Foundation: Population vs. Sample
Before we can differentiate between the two types of statistics, we must understand the core concepts of population and sample. The distinction between these two terms is the primary reason we need two different statistical approaches.
To get a clear picture of this, let's watch a short segment from a tutorial on quantitative data analysis.
Quantitative Data Analysis 101 Tutorial: Descriptive vs Inferential Statistics (With Examples)
This video from Grad Coach explains the fundamental difference between a 'population' and a 'sample' using a simple and memorable analogy.
Please watch the segment from 04:49 to 07:52. Focus on how the video defines: Population: The entire group you are interested in. Sample: The accessible subset of the population from which you collect data.
To put this in a Swasthawritta context:
- Population: If you want to study the effect of Ashwagandha on stress in IT professionals, the population is all IT professionals. This group is vast and practically impossible to study in its entirety.
- Sample: You might recruit 200 IT professionals from a few companies in Bengaluru for your study. This group of 200 is your sample.
The central goal of research is to learn something about the population by studying the sample. This is precisely where descriptive and inferential statistics play their distinct roles.
2. Descriptive Statistics: Describing Your Slice of the Cake
Descriptive statistics do exactly what the name implies: they describe or summarize the data from your sample. They don't make any conclusions beyond the data you have in front of you. Their purpose is to organize the data into a manageable and understandable format.
Key functions of descriptive statistics in an intervention study:
- To summarize the characteristics of your participants (e.g., average age, gender distribution).
- To present baseline values of your outcome measures (e.g., the average stress score before the intervention).
- To check if your intervention and control groups were comparable at the start of the study.
The following video section details the most common types of descriptive statistics.
Quantitative Data Analysis 101 Tutorial: Descriptive vs Inferential Statistics (With Examples)
Let's continue with the Grad Coach video to learn about the common metrics used in descriptive statistics.
Watch the segment from 07:52 to 12:00. Pay attention to the definitions of: Measures of Central Tendency: Mean (average), Median (midpoint), and Mode (most frequent). Measures of Dispersion (Variability): Standard Deviation (how spread out the data is).
Application in an Ayurvedic Study
Let's see how this looks in a real research paper. The following resource is a study investigating the effectiveness of Swasthavritta Aahar (Ayurvedic dietary principles).
Dr. Sushama Bhushanram Warhade
This paper, 'Effectiveness Of Swasthavritta Aahar...', provides an excellent, practical example of statistical analysis in an Ayurvedic context. We will first look at how the authors used descriptive statistics.
Please read the 'Research Methodology' section and examine 'Table 1: Descriptive Statistics' and its interpretation. Focus on understanding how the authors use Mean and Standard Deviation to summarize the two groups in their sample.
As you saw in the paper, Table 1 is a classic example of descriptive statistics at work.
- Mean: The authors report that the mean "Overall Health Assessment" score was 8.6 for the Ayurvedic diet group and 6.8 for the modern diet group. This gives us a single number that represents the central tendency of each group's health score within the sample.
- Standard Deviation (SD): The SD for the Ayurvedic group was 1.2, while for the modern diet group it was 1.6. This tells us that the health scores in the modern diet group were slightly more spread out or variable than in the Ayurvedic group.
At this stage, we have only described the 100 people in the study. We cannot yet claim that an Ayurvedic diet is definitively better for everyone. We are simply painting a picture of our sample.
3. Inferential Statistics: Generalizing to the Whole Cake
While descriptive statistics describe the sample, inferential statistics help us make inferences or generalize our findings from the sample to the larger population. This is where we perform hypothesis testing to determine if the effects we see in our sample are "real" and not just due to random chance.
This is the part of the analysis that answers the primary research question, such as: "Does my intervention work?"
The Logic of Inferential Statistics
To make these inferences, we use a formal process of hypothesis testing. Let's explore the core components of this process.
Statistics: Basics – Epidemiology & Biostatistics | Lecturio
This video from Lecturio Medical, framed for a clinical audience, explains the foundational ideas of inferential statistics, including hypothesis testing and p-values.
Please watch from 08:15 to 09:24 and then from 11:46 to 16:15. This will cover: The distinction between descriptive and inferential statistics. The concept of the Null Hypothesis (H_0): The default assumption that there is no effect or no difference. The role of the p-value: A measure of evidence against the null hypothesis.
Key Concepts in Hypothesis Testing:
- Null Hypothesis (): A statement of no effect. In our example study, the null hypothesis would be: "Swasthavritta Aahar has no effect on health scores."
- Alternative Hypothesis (): The statement that there is an effect. "Swasthavritta Aahar has a significant positive effect on health scores."
- p-value: The probability of observing the data you collected (or something more extreme) if the null hypothesis were true.
- A small p-value (typically < 0.05) suggests that your observed data is unlikely if there's truly no effect. This gives you evidence to reject the null hypothesis in favor of the alternative. The popular mnemonic is: "If the P is low, the null must go."
Common inferential tests include the t-test (to compare means of two groups), ANOVA (to compare means of more than two groups), and the chi-square test (to compare categorical data).
Application in the Ayurvedic Study
Now, let's return to the Swasthavritta Aahar paper and see how the authors used inferential statistics.
Dr. Sushama Bhushanram Warhade
We will now look at Table 2 from the same paper to see inferential statistics in action.
Please examine 'Table 2: Hypothesis Testing' and its interpretation. Focus on the 'p-value' and the authors' conclusion.
In Table 2, the authors use a t-test to compare the health scores of the two groups.
- They found a p-value of 0.0001.
- Since this p-value is much smaller than the standard cutoff of 0.05, they rejected the null hypothesis.
- This allowed them to conclude that the higher health score in the Ayurvedic diet group was not just a fluke in their sample but represents a statistically significant difference. They can now infer that Swasthavritta Aahar is likely to have a positive effect on health in the broader population from which the sample was drawn.
4. Bringing It All Together: The Roles in an Intervention Study
Let's summarize the complementary roles of descriptive and inferential statistics in the context of a Swasthawritta clinical trial.
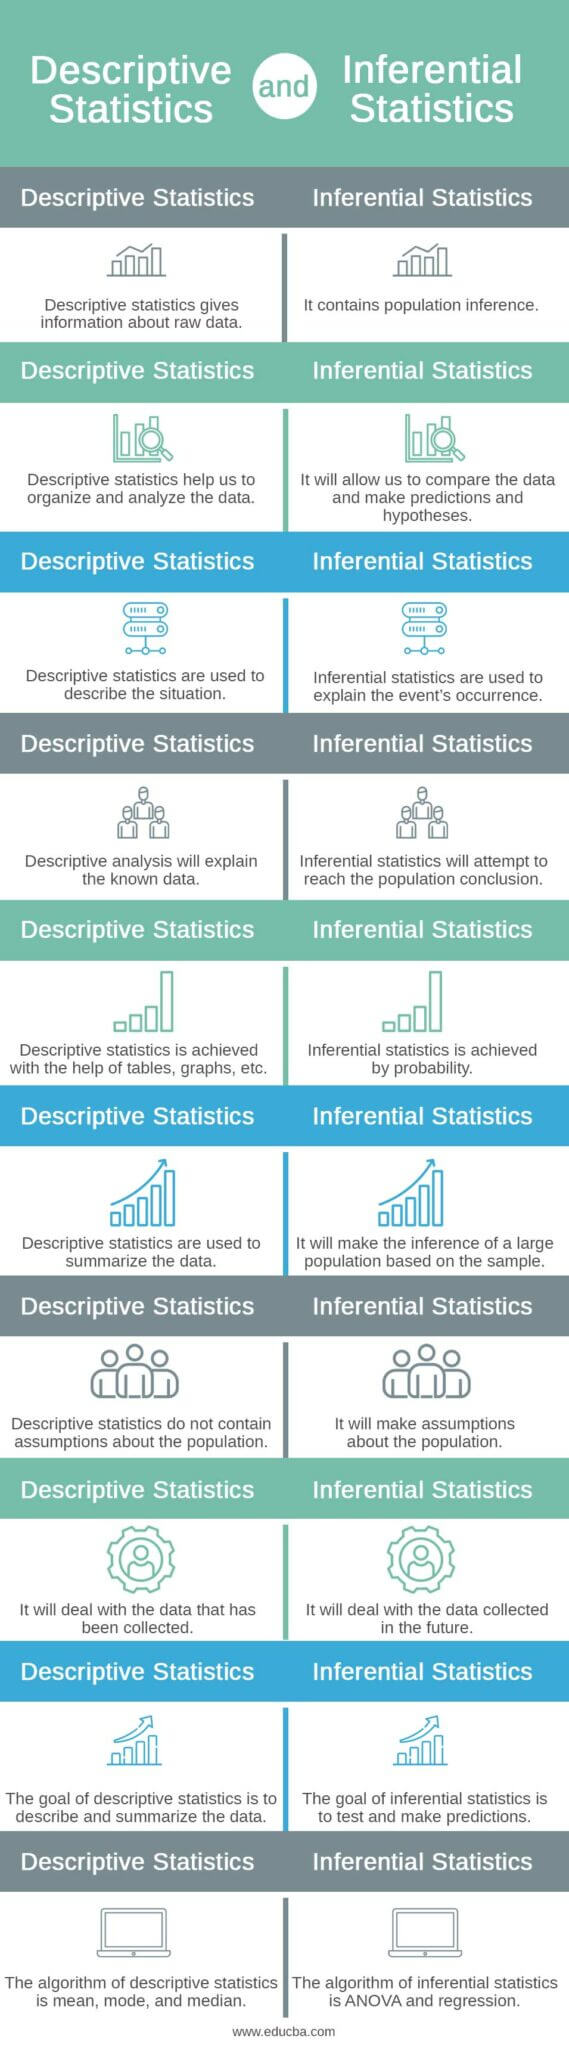
Scenario: You are testing if a specific Pranayama technique (intervention) reduces anxiety scores compared to a simple breathing awareness exercise (control) in 80 university students.
-
Role of Descriptive Statistics:
- Describe Participants: You first use descriptive statistics to create a "Table 1" that summarizes your sample. You would report the mean age, the percentage of male/female participants, and, crucially, the mean baseline anxiety scores for both the Pranayama group and the control group.
- Purpose: This demonstrates who was in your study and checks for baseline comparability. If the Pranayama group happened to have much lower anxiety to start with, it would bias your results. Descriptive statistics help you confirm that the two groups were similar before the intervention began.
-
Role of Inferential Statistics:
- Test the Hypothesis: After the 8-week intervention, you compare the final anxiety scores (or the change in scores) between the two groups using an inferential test (like an independent t-test).
- Make a Conclusion: The test yields a p-value. If p < 0.05, you reject the null hypothesis ("Pranayama has no effect on anxiety"). You can then conclude that the Pranayama technique was significantly more effective at reducing anxiety than the control exercise.
- Purpose: This allows you to generalize your finding beyond the 80 students in your study, making a scientific claim about the potential benefit of this Pranayama technique for the wider population of university students.
Test your understanding!
A study investigates the effect of a 3-month Amalaki Rasayana regimen versus a placebo on the hemoglobin (Hb) levels of 50 patients with mild anemia.
- The researchers report: "The mean baseline Hb was 10.2 g/dL (SD=0.5) for the Rasayana group and 10.1 g/dL (SD=0.6) for the placebo group."
- After the intervention, they report: "The increase in Hb was significantly greater in the Rasayana group compared to the placebo group (t=4.1, p=0.002)."
- Which statement uses descriptive statistics, and what is its role here?
- Which statement uses inferential statistics, and what does it allow the researchers to conclude?
Show answer
-
The first statement—"The mean baseline Hb was 10.2 g/dL (SD=0.5)..."—uses descriptive statistics (mean and standard deviation). Its role is to describe the starting hemoglobin levels of the two sample groups and demonstrate that they were comparable at the beginning of the study.
-
The second statement—"...significantly greater... (t=4.1, p=0.002)"—uses inferential statistics (a t-test resulting in a t-value and a p-value). Because the p-value (0.002) is less than 0.05, it allows the researchers to reject the null hypothesis and conclude that the Amalaki Rasayana regimen is effective for increasing hemoglobin levels in the broader population of patients with mild anemia, not just in their specific sample.
Conclusion
Today we've demystified the two fundamental branches of data analysis. We've seen that they are not opposing methods, but rather partners in the scientific process, each with a distinct and vital role.
Key Takeaways:
- Descriptive Statistics summarize and describe the characteristics of your immediate sample. They answer the question, "What does my data look like?" Common tools include mean, median, and standard deviation.
- Inferential Statistics use data from your sample to make generalizations or predictions about the broader population. They answer the question, "What do my results mean for the real world?" Common tools include t-tests, ANOVA, and the interpretation of p-values.
- In an intervention study, descriptive statistics are used to characterize the sample and ensure baseline comparability, while inferential statistics are used to test the hypothesis and determine if the intervention had a statistically significant effect.
Preview of the Next Lesson:
We now understand why we need inferential statistics to test our hypotheses. However, there are many different inferential tests available. How do you know whether to use a t-test, a chi-square test, or another method? In our next lesson, we will address the learning outcome: "Choose appropriate basic statistical tests (e.g., t-test, chi-square) to compare groups based on the type of data collected." This will equip you with the practical knowledge to select the right statistical tool for your specific research question.