In our last lesson, we explored how simple linear regression models the relationship between two continuous variables, like price and fuel efficiency. We learned to interpret its slope as the change in the outcome for a one-unit change in the predictor. However, in epidemiology, we are often concerned with binary outcomes: developing a disease or not, being exposed to a risk factor or not. A straight line is ill-suited for these "yes/no" scenarios.
This lesson introduces logistic regression, the workhorse for modeling binary outcomes. We will bridge the gap between linear regression and this new technique by exploring the concepts of odds and log-odds. Your main goal is to become proficient at interpreting the coefficients of a logistic regression model, a skill that is absolutely central to understanding published research in health sciences and a key concept in classification models used in machine learning.
From Straight Lines to S-Curves
Imagine we want to model the probability of a person having coronary heart disease (CHD) based on their age. The outcome is binary (CHD: yes=1, no=0), and the probability must be between 0 and 1. If we try to fit a simple linear regression line, it might predict probabilities less than 0 for very young people or greater than 1 for very old people, which is nonsensical.
To solve this, we need a function that takes any linear combination of predictors and "squishes" the output into the [0, 1] range. The function that does this is the logistic function, which produces a characteristic S-shaped curve (a sigmoid curve).
However, to build our model, we do something clever. Instead of modeling the probability directly, we transform it in a way that allows us to use a linear equation, just like in the last lesson. This transformation involves two steps: from probability to odds, and from odds to log-odds.
The Logit Transformation: From Probability to Log-Odds
Let's break down these essential concepts.
- Probability (p): The likelihood of an event occurring, ranging from 0 to 1.
- Odds: The ratio of the probability of an event happening to the probability of it not happening.
For example, if the probability of having a disease is 0.2 (20%), the odds are . We can say the odds are "1 to 4". Unlike probability, odds range from 0 to positive infinity. - Log-Odds (or Logit): The natural logarithm of the odds.
Taking the logarithm of the odds transforms the scale from [0, +∞) to (-∞, +∞). This is the crucial step! Because the log-odds are unbounded, we can now model them with a simple linear equation. This transformation is called the logit link function.
The following reading explains this transformation very clearly.
FAQ: How do I interpret odds ratios in logistic regression?
This article from UCLA's statistics consulting group provides an excellent introduction to the concepts that underpin logistic regression.
Please read the section titled From probability to odds to log of odds. Pay attention to the tables that show how probability, odds, and log-odds relate to each other. Notice how the log-odds scale covers the full range of real numbers.
The StatQuest video below gives a fantastic visual intuition for how this logit transformation converts the S-shaped logistic curve into a straight line, which is why we can apply a linear model to it.
Logistic Regression Details Pt1: Coefficients
This video, "Logistic Regression Details Pt1: Coefficients," by Josh Starmer, provides an excellent conceptual overview of why we use log-odds.
Watch from this segment, which demonstrates how the y-axis is transformed from probability to log-odds, turning the "squiggly line" into a straight one. This is the core conceptual trick of logistic regression.
The Logistic Regression Model and Its Coefficients
With the logit transformation, the logistic regression model looks strikingly similar to the linear regression model:
Here:
- The left side is the log-odds of the outcome.
- The right side is a linear equation with an intercept () and a slope () for our predictor variable .
The coefficients ( and ) are estimated from the data, typically using a method called maximum likelihood estimation (which we will cover in a later lesson). Our focus now is on what these coefficients mean once we have them.
There are three primary ways to interpret the coefficients, as summarized in the infographic below. We will focus on the last two, as they are the most useful.

Interpretation 1: The Log-Odds (The "Raw Math")
The most direct interpretation is in terms of log-odds.
- : For a one-unit increase in , the log-odds of the outcome is expected to change by .
- : This is the log-odds of the outcome when .
While mathematically correct, "log-odds" are not very intuitive for most people. Therefore, we typically take one more step and convert the log-odds back into a more understandable scale: the odds ratio.
Interpretation 2: The Odds Ratio (The Most Common Method)
To get from log-odds back to odds, we use the inverse of the natural logarithm, which is exponentiation (i.e., raising to the power of the coefficient).
The odds ratio (OR) is calculated as or .
- : For a one-unit increase in , the odds of the outcome are multiplied by a factor of .
How to interpret the odds ratio value:
- If OR > 1, the odds of the outcome increase as increases. For example, an OR of 1.5 means the odds increase by 50% for each one-unit increase in X.
- If OR < 1, the odds of the outcome decrease as increases. For example, an OR of 0.8 means the odds decrease by 20% (or are 80% of the original odds) for each one-unit increase in X.
- If OR = 1, there is no association between and the odds of the outcome.
The following resource provides a clear walkthrough of this interpretation.
5 Binomial Logistic Regression for Binary Outcomes
This chapter from the book "People Analytics and Regression" clearly explains how to model and interpret the coefficients.
Please read the section Modeling the log odds and interpreting the coefficients. It shows how to get the coefficients and then convert them to an odds ratio by exponentiating them.
Examples of Interpretation
Let's apply this to a concrete example from an epidemiological study. The image below shows the output of a logistic regression analysis estimating the risk of cardiovascular disease (CVD) for people who are obese.
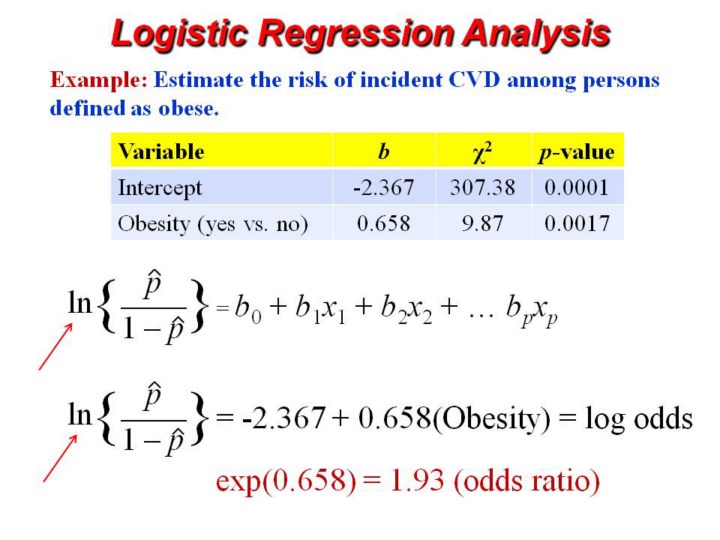
Let's interpret the coefficient for the Obesity variable, which is .
-
As Log-Odds: The log-odds of having CVD for an obese person is 0.658 higher than for a non-obese person.
-
As an Odds Ratio: We exponentiate the coefficient: .
- Interpretation: The odds of having CVD are 1.93 times higher for obese individuals compared to non-obese individuals.
- Alternatively, we can say that the odds of having CVD are 93% higher for obese individuals.
The following video provides more excellent examples of interpreting coefficients for both continuous and categorical predictor variables.
Logistic Regression I | Statistics for Applied Epidemiology | Tutorial 5
This tutorial, "Logistic Regression I" from MarinStatsLectures, is specifically designed for applied epidemiology and provides clear, relevant examples.
Please watch the following segments: Interpretation for a binary variable (like weight > 170 lbs). Calculating and interpreting the odds ratio for that binary variable. Interpretation for a continuous variable (like weight in pounds).
A Crucial Distinction: Odds vs. Probability
It is extremely common for people to misinterpret an odds ratio as a "risk ratio" or to say that the probability increases by a certain percentage. This is incorrect. An odds ratio of 2.0 does not mean the probability of the outcome doubles.
The relationship between odds and probability is non-linear. A change in odds has a different impact on probability depending on the starting point. If the baseline probability is low, a change in odds results in a similar change in probability. However, if the baseline probability is high, the same change in odds will have a much smaller effect on the probability.
5 Binomial Logistic Regression for Binary Outcomes
This section of the "People Analytics" chapter explains the critical difference between odds and probability.
Please read the section Odds versus probability. The graphs in this section are very effective at illustrating why you cannot equate a change in odds with the same change in probability.
Conclusion
In this lesson, you have learned the fundamental theory and practical interpretation of logistic regression, a cornerstone of modern epidemiology and biostatistics.
Here are the key takeaways:
- Logistic regression is used to model binary outcomes (0/1, yes/no).
- It works by modeling the log-odds of the outcome as a linear function of the predictor variables: .
- A regression coefficient () represents the change in the log-odds of the outcome for a one-unit change in the predictor.
- The odds ratio () is a more intuitive measure. It represents the multiplicative factor by which the odds of the outcome change for a one-unit change in the predictor.
- An odds ratio is not the same as a probability or risk ratio, and this distinction is crucial for correct interpretation.
We have now covered the two most fundamental regression models: linear for continuous outcomes and logistic for binary outcomes. In our next lesson, we will formally define epidemiology and explore the core measures of disease frequency—incidence and prevalence—that are often the outcomes we seek to model with these powerful statistical tools.