Welcome to our next lesson. In our previous session, we delved into logistic regression, a powerful tool for modeling binary outcomes like the presence or absence of a disease. Now, we will take a step back from the specific statistical methods to understand the broader field in which these tools are applied. This lesson introduces you to the discipline of epidemiology and its most fundamental concepts: incidence and prevalence.
Your goal for this lesson is to define epidemiology and, most importantly, to clearly distinguish between incidence and prevalence as the two primary ways we measure the frequency of disease in a population. Understanding this distinction is not just academic; it's the bedrock upon which all epidemiological study design and analysis is built.
What is Epidemiology?
At its heart, epidemiology is the science of public health. It's the detective work that uncovers the patterns, causes, and effects of health and disease conditions in defined populations. The word itself comes from Greek: epi ("upon"), demos ("people"), and logos ("study"). It is literally "the study of what is upon the people."
To get a feel for the scope of this field, watch this introductory segment from Crash Course Public Health.
Intro to Epidemiology: Crash Course Public Health #6
This video provides a concise and engaging overview of what epidemiology is and how its focus has evolved over time.
Watch the segment from the main definition through the discussion of how the field has expanded beyond just infectious diseases. Pay attention to the "who, what, where, and when" questions that epidemiologists ask.
As the video highlights, epidemiology is not just about outbreaks of infectious diseases like the flu or COVID-19. It encompasses the study of chronic diseases like cancer and heart disease, the health effects of environmental exposures like air pollution, and even the systemic health inequities that exist between different communities. Your interest in data science is highly relevant here, as modern epidemiology relies heavily on analyzing large and complex datasets to uncover these patterns.
Quantifying Disease: Incidence and Prevalence
The first task of an epidemiologist is to count and quantify. To answer "who gets sick?" or "how common is this disease?", we need a systematic way to measure disease frequency. Simply counting the number of sick people (e.g., 100,000 cases of flu in New York City) isn't very useful for comparisons without knowing the size of the population it came from.
This is where epidemiologists use two key measures: prevalence and incidence.
Before we dive into their definitions, it's helpful to understand the difference between a prevalent case and an incident case.
[PDF] Incident vs. Prevalent Cases and Measures of Occurrence
This guide from the University of North Carolina provides very clear, concise definitions of the core terms we are discussing.
First, read the paragraph that defines prevalent and incident cases. Then, you can refer to the "Terminology" box near the end of the document for a quick summary of all the key definitions.
Now, let's explore each concept in more detail.
Prevalence: A Snapshot of Disease Burden
Prevalence tells us what proportion of a population has a disease at a single point in time. It's a "snapshot" of the population's health status. It includes all existing cases, regardless of when they were diagnosed.
The formula is:
Prevalence is typically expressed as a percentage or per 1,000 people. Its primary use is to measure the burden of a disease in a community, which is essential for planning health services, allocating resources, and administrative purposes. For example, knowing the prevalence of diabetes helps a hospital system estimate how many diabetes education specialists it needs to employ.
Incidence: The Flow of New Cases
Incidence measures the rate at which new cases of a disease develop in a population over a specified period. It's a measure of the "flow" of people from a healthy state to a diseased state. Critically, the denominator for incidence is the population at risk—that is, people who are capable of getting the disease. We exclude anyone who already has the disease or is immune.
One common measure of incidence is the Incidence Proportion (also called Cumulative Incidence or Risk):
Incidence is the fundamental measure for investigating the causes or etiology of a disease. Because it only includes new cases, it allows us to identify risk factors that precede the onset of the disease. Most of the analytical study designs we'll discuss later in this course are designed to compare the incidence of disease between different groups.
The following resource provides detailed explanations and examples for both prevalence and incidence.
Measures of Disease Frequency – Foundations of Epidemiology
This chapter from an open-source epidemiology textbook offers a comprehensive look at measures of disease frequency.
Please read the following sections: Incidence and Prevalence, which introduces the two measures. The section on Prevalence, starting from its definition through the examples. Notice the difference between point prevalence and period prevalence. The first part of the section on Incidence, from the definition and initial examples of incidence proportion. We will cover person-time and incidence rates in the next lesson, so you can skim that for now. Finally, read the section on the uses of each measure.
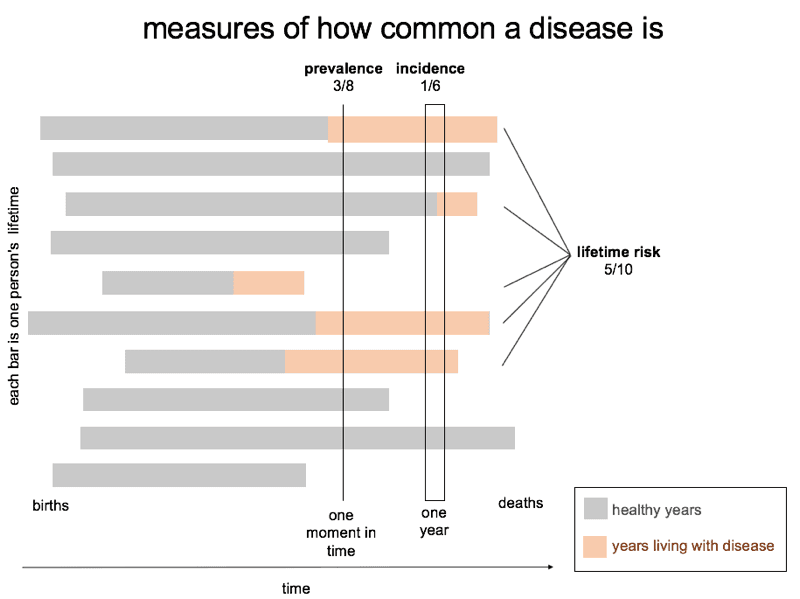
The image below visualizes these concepts for a small, hypothetical population of 10 people. Prevalence is measured at a single point in time, while incidence is measured over a period (one year).
The Bathtub Analogy: Distinguishing Prevalence and Incidence
The relationship between incidence and prevalence can be confusing. The most common and effective way to visualize it is the "epidemiologist's bathtub" analogy.
Imagine a bathtub:
- The water flowing into the tub from the tap is Incidence (new cases).
- The water currently in the tub is Prevalence (all current cases).
- Water leaving the tub through the drain or by evaporation represents people being cured or dying.
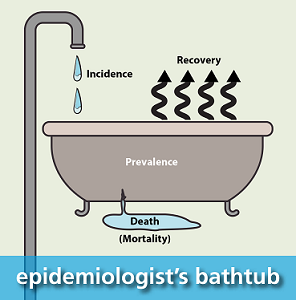
This analogy makes it clear that prevalence is influenced by two factors: the incidence rate and the duration of the disease. A disease can have a high prevalence in two ways:
- A very high incidence rate (the tap is on full blast).
- A very long duration (the drain is clogged), even if the incidence is low.
This leads to a very important approximate relationship:
The following video provides an excellent summary of these concepts and uses a similar analogy to explain this crucial relationship with clear examples.
Incidence and Prevalence - Everything you need to know
This video from Medmastery does a fantastic job of defining, differentiating, and showing the relationship between incidence and prevalence.
Please watch the entire video from start to finish. The example comparing coronary heart disease in two fictional populations is especially important, as it demonstrates why a higher prevalence does not automatically mean a higher risk of getting the disease.
As the video's final example shows, a population can have a higher prevalence of a disease simply because its healthcare is better, leading to longer survival times (a longer duration), even if the rate of new cases (incidence) is exactly the same as in another population. This is a critical insight for interpretation. Mistaking high prevalence for high risk is a very common error.
Conclusion
In this lesson, we have defined the field of epidemiology and established the fundamental distinction between its two main measures of disease frequency.
Here are the key takeaways:
- Epidemiology is the study of the distribution and determinants of health conditions in populations.
- Prevalence is a snapshot of existing cases at a point in time. It measures the overall burden of a disease and is used for resource planning.
- Incidence is the flow of new cases over a period of time among a population at risk. It measures risk and is used to study the causes of disease.
- The two are related by the duration of the disease: Prevalence ≈ Incidence × Duration. An increase in prevalence could be due to rising incidence or longer survival times.
You've now moved from the statistical tools (like logistic regression) to the core conceptual framework of the field where they are used. In our next lesson, we will build directly on this foundation. We'll take a closer look at the different ways to calculate these measures, such as cumulative incidence and incidence rates, and prepare to use them to calculate our first measures of association.