In our previous lessons, we explored cohort studies, where we start with an exposure and follow people forward in time to see if they develop a disease. This design is powerful, but what if the disease is extremely rare? Following thousands of people for decades just to observe a handful of cases would be inefficient and costly. Today, we'll examine a study design that elegantly solves this problem by flipping the logic: the case-control study.
This lesson will introduce you to this retrospective design. Your goal is to understand how case-control studies are structured, why they cannot use the risk and rate ratios we learned about previously, and how they instead rely on a different measure of association called the odds ratio.
A Different Direction: From Outcome to Exposure
Imagine you're a systems administrator trying to debug a rare server crash. You wouldn't watch thousands of healthy servers waiting for one to fail. Instead, you'd start with the crashed server (the "case") and a few healthy servers (the "controls"). Then, you'd look backward through their logs (their "past exposures") to see what was different. Did the crashed server run a specific piece of software that the others didn't?
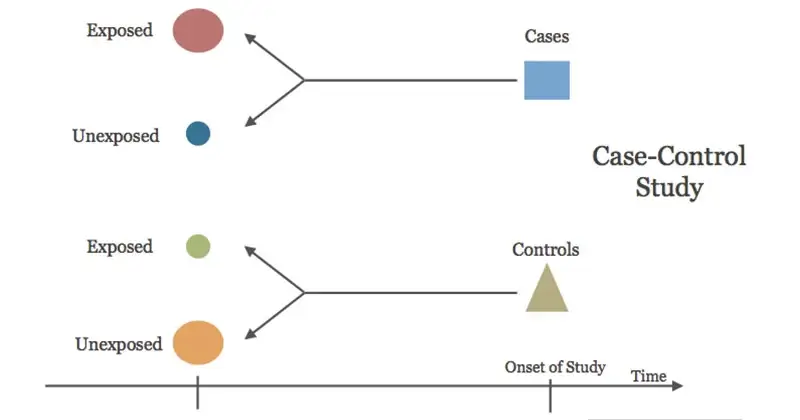
Case-control studies work on the same principle. They are retrospective, meaning they look back in time. The study begins by identifying two groups of people:
- Cases: A group of individuals who have the disease or outcome of interest.
- Controls: A group of individuals from the same source population who do not have the disease.
The investigator then looks back in time to compare the frequency of past exposures between the two groups. The central question is: "Was the exposure more common among the cases than the controls?"
This visual diagram illustrates the backward-looking nature of a case-control study.
The following video provides a concise overview of this design.
Case control and cohort studies
This video from "Global Health with Greg Martin," who you'll recognize from our last lesson, offers a clear introduction to the case-control study design.
Please watch the first part of the video, focusing on these two segments: The fundamental concept, where the presenter explains how the study starts with cases and controls and looks backward at exposure history. The importance of matching cases and controls to ensure they are comparable, which is a critical design challenge.
The Measurement Problem: Why We Can't Use Risk Ratios
In a cohort study, we calculated risk by dividing the number of new cases by the total number of people in a group (e.g., ). We can't do this in a case-control study. Why? Because the researcher chooses how many cases and controls to include.
For instance, a researcher might decide to study 100 cases of a rare cancer and recruit 200 controls. The proportion of cases in the study (100 out of 300, or 33%) is determined by the study design, not the natural incidence of the cancer in the population, which might be less than 0.01%. Since we don't have the true population denominators, we cannot calculate the risk or incidence rate of the disease.
So, how do we measure the association? We need a different metric.
The Solution: Comparing Odds with the Odds Ratio
Instead of comparing the risk of disease between exposed and unexposed groups, we compare the odds of prior exposure between the case and control groups.
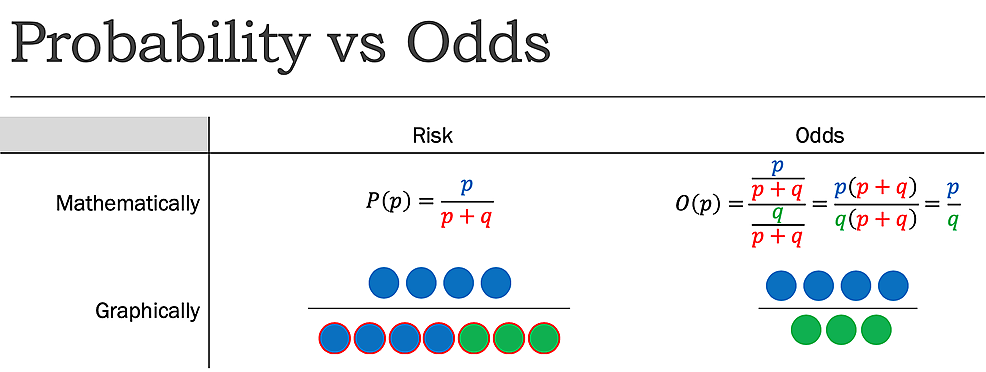
First, let's clarify the difference between probability (or risk) and odds.
- Probability (Risk): The chance of an event happening out of all possibilities.
- Odds: The ratio of the chance of an event happening to the chance of it not happening.
In a case-control study, we set up our 2x2 table as before:
| Cases (D+) | Controls (D-) | |
|---|---|---|
| Exposed (E+) | A | B |
| Unexposed (E-) | C | D |
We then calculate two sets of odds:
- Odds of exposure among the cases: This is the ratio of exposed cases to unexposed cases, or .
- Odds of exposure among the controls: This is the ratio of exposed controls to unexposed controls, or .
The Odds Ratio (OR) is simply the ratio of these two odds. It tells us how much higher (or lower) the odds of exposure are for cases compared to controls.
The following reading explains this logic clearly.
[PDF] Case-Control Studies - UNC Gillings School of Public Health
This document from the University of North Carolina provides a foundational explanation of case-control studies and the odds ratio.
First, read the introduction on the first page, from the start of the document. Then, on the second page, read the section "Measures of incidence in case-control studies". This part explains why we can't measure incidence and formally introduces the exposure odds ratio and its interpretation.
Interpreting the Odds Ratio
The interpretation of the odds ratio is very similar to that of the risk ratio. The null value, indicating no association, is 1.0.
- OR > 1: The exposure is associated with an increased odds of the disease. (e.g., OR = 3.0 means the cases have three times the odds of having been exposed compared to the controls).
- OR < 1: The exposure is associated with a decreased odds of the disease (a protective factor).
- OR = 1: The odds of exposure are the same for cases and controls; there is no association.
A precise interpretation would be: "The odds of having [the prior exposure] were [OR value] times as high among individuals with [the disease] compared to individuals without [the disease]."
A key feature of the odds ratio is that when the disease is rare (a common reason for doing a case-control study in the first place), the OR provides a good approximation of the risk ratio (RR). For this reason, in the context of a rare disease, you will often see the OR from a case-control study interpreted as if it were a risk ratio.
Strengths and Weaknesses
Like any tool, the case-control study has its specific strengths and weaknesses. Understanding these is crucial for interpreting its results.
Design, applications, strengths and weaknesses of cross-sectional ...
This resource from Health Knowledge UK provides a concise summary of the pros and cons of this study design.
Please read the section titled Strengths and weaknesses of case-control studies. Pay close attention to the weaknesses, especially the susceptibility to recall bias (cases may remember past exposures differently than controls) and selection bias (if the control group isn't truly representative of the population that produced the cases).
To solidify your understanding, let's watch a final short video that summarizes the key concepts and contrasts them with cohort studies.
Epidemiological Studies: A Beginners guide
This animated guide from "Let's Learn Public Health" is a great way to review the core ideas of case-control studies.
Watch the segment on case-control studies, from the beginning of the section. It covers the design, the odds ratio, an example, and the main advantages and disadvantages.
Practice Calculation
Let's put this into practice. Using the knowledge you've gained, you can now analyze data from a hypothetical case-control study.
[PDF] Case-Control Studies - UNC Gillings School of Public Health
Return to the UNC document to test your understanding with a practice problem.
Find Practice Question 2 on page 5, which describes a study of pancreatic cancer and smoking. First, try to construct the 2x2 table from the data provided. Then, calculate the OR. Finally, try to interpret your result in a sentence. You can check your work against the provided answers on the last page.
Conclusion
In this lesson, we explored the case-control study, a clever and efficient design that works backward from outcome to exposure. It is the go-to method for studying rare diseases where a cohort study would be impractical.
Here are the key takeaways:
- Design: Case-control studies are retrospective. They start by selecting individuals with a disease (cases) and without the disease (controls) and then compare their history of exposure.
- Measure of Association: Because we cannot calculate incidence, we cannot use risk or rate ratios. Instead, we use the Odds Ratio (OR), which compares the odds of exposure among cases to the odds of exposure among controls.
- Interpretation: An OR of 1 means no association, >1 suggests a risk factor, and <1 suggests a protective factor. When a disease is rare, the OR approximates the risk ratio.
- Trade-offs: This design is fast and cost-effective for rare diseases but is vulnerable to biases, particularly recall and selection bias.
In our next lesson, we will complete our tour of observational study designs by examining the strengths and limitations of all three major types—cohort, case-control, and cross-sectional—side by side. This will help you learn how to choose the most appropriate design for a given research question.