Welcome back. In our last lesson, we compared the three main observational study designs and noted that they have different strengths, weaknesses, and levels of susceptibility to errors. We frequently used terms like "selection bias" and "recall bias" to describe potential flaws.
In this lesson, we will formalize these ideas. Your learning outcome is to identify and classify sources of bias in study design, such as selection and information bias. We will define what bias is, distinguish it from other types of error, and then explore its two major categories. Understanding bias is fundamental to critically evaluating any data-driven study, as it represents a systematic flaw in the "logic" of the study that can lead to incorrect conclusions.
From Random Error to Systematic Bias
In any study, the results we observe will almost never be exactly the true value in the population. This deviation can be due to two types of error: random error and systematic error (bias).
- Random Error (Chance): This is the variability that arises from chance alone. If you flip a fair coin 10 times, you might get 6 heads just by chance. If you flip it 1000 times, you're much more likely to get close to 50% heads. Random error is non-directional and can be reduced by increasing the study's sample size.
- Systematic Error (Bias): This is a flaw in the study's design or conduct that causes the results to be consistently distorted in a particular direction. Unlike random error, bias cannot be reduced by increasing the sample size. If your measuring tape is miscalibrated and is one inch too short, measuring more people won't fix the error; it will just make you more precisely wrong.
The following video provides a concise overview of the three major threats to a study's validity: confounding, chance, and bias.
This video from Cochrane Austria introduces the three main sources of error that can lead to false study results.
Watch the initial segment to understand the landscape of potential errors (goal of clinical studies), and then watch the specific definition of bias (another source of error). Note the key distinction: bias is a systematic deviation, while chance is a random error.
Epidemiological studies are ultimately concerned with getting as close to the "truth" as possible. Bias is a major obstacle that can mislead us. Broadly, these systematic errors fall into two main categories, which can be thought of as errors in the inputs of a study.
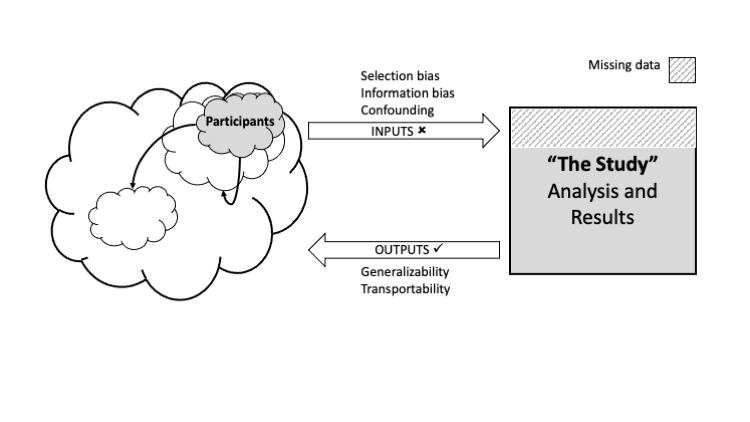
As the diagram illustrates, we'll focus on the two main types of bias that corrupt a study's inputs: selection bias and information bias.
Selection Bias: Are We Studying the Right People?
Selection bias occurs when the procedures used to select study participants—or retain them in the study—lead to a study population that is systematically different from the target population you want to learn about. This bias happens at the recruitment or retention stages.
From your CIS perspective, this is analogous to training a machine learning model on a flawed or non-representative dataset. If you build a spam filter trained only on emails from a decade ago, it will perform poorly on modern spam because the "selection" of training data was biased.
The video below explains this concept using the Framingham Heart Study data we've discussed.
This video from "Data Learner" defines the two main categories of bias and provides a concrete example of how selection bias can occur.
First, watch the general introduction to bias from what is bias?. Then, focus on the section explaining selection bias. The speaker discusses how missing participants from the Framingham study could potentially distort the observed association between smoking and heart disease.
Selection bias can manifest in several ways depending on the study design. The following reading provides detailed examples of its various forms.
[PDF] Observational Studies and Bias in Epidemiology - College Board
This document from the College Board offers clear definitions and excellent, easy-to-understand examples of different types of bias.
First, read the brief overview of the three main types. Then, focus on the section titled "Selection Bias" (pages 20-22). As you read about the different forms, pay attention to the specific study design they are most common in: Nonresponse bias: Why might volunteers in a study be different from those who decline to participate? Hospital admission rate bias (Berkson's bias): Why can selecting controls from the same hospital as cases be problematic in a case-control study? Exclusion bias: What happens if you apply different eligibility criteria to cases and controls? Publicity (or awareness) bias: How can media attention influence who seeks diagnosis or reports symptoms?
Here are some of the most common and important types of selection bias:
- Inappropriate Control Selection (Case-Control Studies): This is a critical vulnerability of case-control studies. Controls should represent the exposure distribution in the source population that produced the cases. A classic example is Berkson's bias, where using hospitalized controls can be problematic because they may have different exposure patterns than the general population. The coffee and pancreatic cancer study, where controls were advised not to drink coffee for other medical reasons, is another prime example of this.
- Loss to Follow-up (Cohort Studies): If people who drop out of a study are systematically different from those who remain, the results can be biased. This is particularly damaging if the dropout rate differs by exposure status (e.g., more unexposed people drop out than exposed people).
- Healthy User/Worker Effect (Cohort Studies): People who are healthy enough to work (or who choose to take a preventative medication like Hormone Replacement Therapy in the famous example) are often systematically healthier than the general population. Comparing them to the general population can create a spurious association between the "exposure" (working, taking the drug) and better health outcomes.
Selection bias is extremely difficult, and often impossible, to correct in the analysis phase. The primary defense is careful study design.
Information Bias: Is the Data We're Collecting Accurate?
Information bias, also called measurement bias or misclassification, occurs when there is a systematic error in the way exposure, outcome, or other variables are measured or classified. This bias happens during the data collection stage. It means the data itself is flawed.
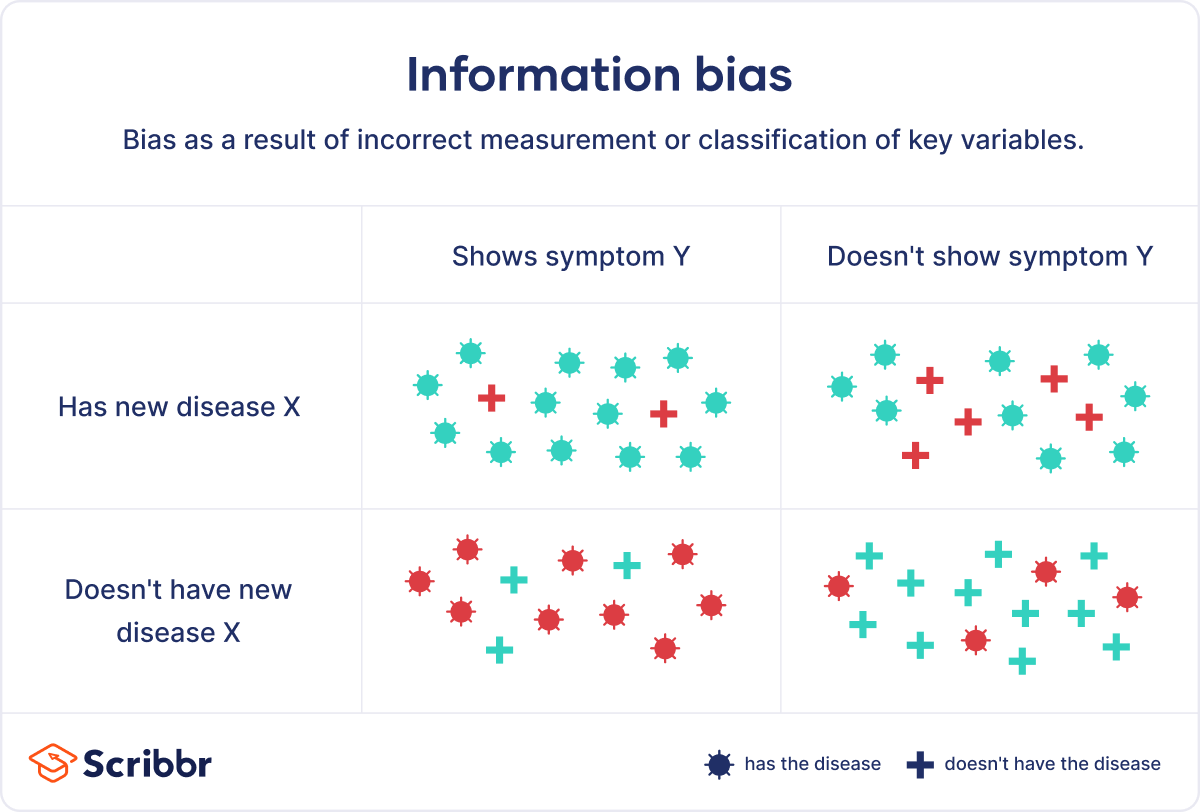
To continue the computer science analogy, this is like using a faulty sensor that consistently reports incorrect temperature readings, or having a data-entry script that always mistakes the number '1' for the letter 'l'. The information itself is corrupted.
The following video section explains this concept.
Let's return to the "Data Learner" video to understand measurement bias.
Watch the section that explains measurement bias. The speaker uses the example of smokers being less likely to have their heart disease diagnosed, leading to an under-reporting of the outcome in that group.
As with selection bias, there are several important sub-types of information bias.
[PDF] Observational Studies and Bias in Epidemiology - College Board
Now, read the section titled "Information Bias" in the same College Board document (pages 22-23). Focus on understanding these common forms: Recall bias: Why is this a particular concern in case-control studies? Interviewer bias: How can an interviewer's knowledge of a participant's case/control status influence data collection? Reporting bias: Why might a participant over- or under-report certain exposures?
Two of the most common types are:
- Recall Bias: Occurs when there are systematic differences in how accurately participants recall past events. This is a major threat in case-control studies. For example, a mother of a child with a rare birth defect (a case) is likely to think much harder about and recall potential exposures during pregnancy than a mother of a healthy child (a control).
- Observer/Interviewer Bias: Occurs when the person recording the data has knowledge of the participant's exposure or disease status, and that knowledge influences their measurements or questions. For instance, an interviewer who knows a participant has lung cancer might probe more deeply for a history of smoking than they would with a healthy control. Blinding is the primary defense against this.
Differential vs. Non-differential Misclassification
A crucial distinction in information bias is whether the measurement error is the same for all groups being compared.
- Non-differential misclassification: The measurement error is the same in all groups. For example, an imprecise scale is used to weigh both the exposed and unexposed groups. This type of bias is problematic, but it usually biases the measure of association towards the null (i.e., it makes the groups look more similar than they really are).
- Differential misclassification: The measurement error differs between groups. For example, cases are asked about exposures more carefully than controls. This is far more dangerous because it can bias the association in any direction—either away from or towards the null—and the direction can be unpredictable.
Practice Identifying Bias
Let's test your ability to identify these biases. The following scenarios are adapted from the "Observational Studies and Bias in Epidemiology" document. For each one, try to identify the most likely type of bias.
Scenario 1: A case-control study is conducted to assess the association between Alzheimer's disease and exposure to aluminum-containing homecare products within the last five years. Information is gathered via an in-home survey of the participants.
What type of bias is most likely here? Click to reveal the answer.
**Recall bias** (an information bias). Individuals with Alzheimer's disease (cases) have memory problems and are less likely to accurately remember their past use of these products compared to controls. This would likely lead to an *underestimation* of the association.Scenario 2: A case-control study of fatal car crashes compares crash victims (cases) with living drivers (controls). Blood samples are taken from all fatalities to chemically measure blood-alcohol content. For the living controls, data on alcohol use is gathered via a self-report interview.
What type of bias is most likely here? Click to reveal the answer.
**Information bias** (specifically, differential misclassification). Data is being collected via two different methods of different accuracy. The controls are likely to underreport alcohol use because of its social and legal implications, while the cases have an objective measurement. This will lead to an *overestimation* of the association between alcohol and fatal crashes.Conclusion
In this lesson, you have learned to distinguish systematic bias from random error and to identify the two major categories of bias that threaten the validity of a study's findings.
Here are the key takeaways:
- Bias is a systematic error in study design or execution that distorts results in a consistent direction. It cannot be fixed by increasing sample size.
- Selection Bias concerns who gets into the study and who stays in it. It occurs when the study population is not representative of the target population in a way that relates to the exposure and outcome.
- Information Bias concerns how data are collected. It occurs when measurements or classifications of exposure or outcome are systematically inaccurate.
- The primary strategy for dealing with bias is prevention through careful study design, such as using robust sampling methods, blinding, and standardized data collection protocols.
In this module, we have now covered the major observational study designs and the biases that can affect them. We have briefly mentioned a third threat to validity: confounding. This occurs when the effect of the exposure is mixed up with the effect of another variable. Our next module will be dedicated entirely to defining, identifying, and controlling for confounding.