Welcome to the first lesson of our second module. In the previous module, we built a strong foundation, covering everything from basic statistical concepts to the principle of maximum likelihood estimation. You learned how to measure disease frequency with prevalence and incidence, and how to quantify associations using odds ratios. Now, we shift from these foundational concepts to their application in the real world by exploring different epidemiological study designs.
This module focuses on observational studies, where we observe exposures and outcomes without intervening. We'll begin with the most common and straightforward design: the cross-sectional study. Your goal for this lesson is to describe the design of a cross-sectional study and understand its principal strengths and limitations, which are crucial for critically interpreting their findings.
What is a Cross-Sectional Study?
At its core, a cross-sectional study is like taking a snapshot of a population at a single point in time. Researchers select a group of individuals and simultaneously collect data on both their current health status (the outcome) and other characteristics, including potential risk factors (the exposures).
Because it captures everything at one moment, this design is fundamentally different from a longitudinal study, which would follow the same individuals over a period, like recording a movie.

The following short video provides a clear and concise introduction to this concept.
Epidemiological Studies: A Beginners guide
This clip from "Let's Learn Public Health" explains the 'snapshot' nature of cross-sectional studies and their common use as prevalence studies.
Please watch the section on cross-sectional studies, which starts at this timestamp. Note how it connects the study design directly to the measurement of prevalence, a concept we covered in the first module.
As the video highlighted, because these studies measure the proportion of a population that has a disease at a specific time, they are often called prevalence studies. This makes them incredibly useful for public health officials who need to understand the burden of a disease in a community to plan services and allocate resources.
Design and Types of Cross-sectional Studies
Cross-sectional studies can be categorized based on their primary goal. The following reading from the Health Knowledge public health textbook outlines these types and other key design considerations.
Design, applications, strengths and weaknesses of cross-sectional ...
This resource provides a structured overview of the design and purpose of cross-sectional studies.
Please read the first two main sections of the article. Start with the introduction and the section on Types of cross-sectional study. Focus on the distinction between a descriptive study, which measures frequency, and an analytical study, which investigates associations. Next, read the section on Issues in the design of cross-sectional surveys. Pay attention to the importance of a representative sample for ensuring the findings can be generalized to the broader population.
To summarize the key points from the reading:
- Descriptive studies aim to answer "what is the prevalence of X?" For example, a survey to determine the percentage of adults in a city with hypertension. This is analogous to the exploratory data analysis (EDA) phase in a data science project, where the goal is to characterize the data.
- Analytical studies aim to answer "is exposure Y associated with outcome X?" For example, a survey to see if there is an association between a sedentary lifestyle and hypertension in that same group of adults.
- Sampling is critical. If the sample of people in the study is not representative of the larger population of interest, the results will suffer from selection bias, and the conclusions may not be valid for anyone outside the study group.
Strengths of Cross-sectional Studies
The "snapshot" design, while simple, comes with several powerful advantages that make it one of the most frequently used study designs in public health research.
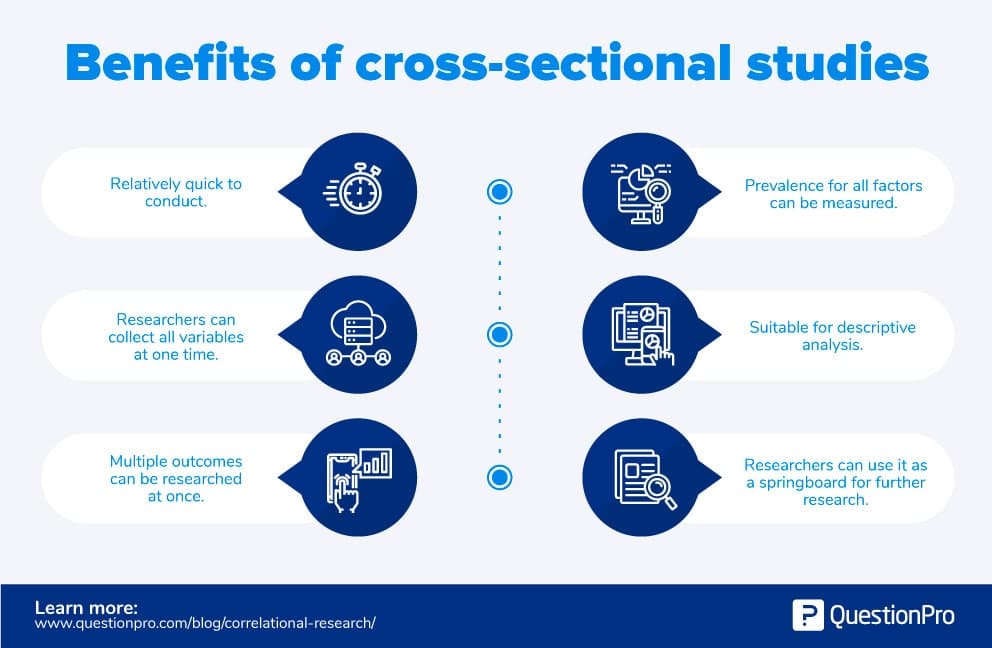
The key strengths, as summarized in the graphic and various resources, are:
- Efficiency: They are relatively quick, inexpensive, and easy to conduct since there is no follow-up period. Data is collected only once.
- Multiple Factors: You can gather data on many exposures and outcomes at the same time. A single health survey could ask about diet, exercise, smoking, and the presence of diabetes, heart disease, and asthma.
- Prevalence Assessment: They are the best way to determine the prevalence of health conditions or risk factors in a population.
- Hypothesis Generation: Findings from a cross-sectional study can provide preliminary evidence for an association, which can then be investigated more rigorously with other study designs.
Limitations: The "Chicken and Egg" Problem
Despite their strengths, the simplicity of cross-sectional studies is also the source of their most significant weakness. Because exposure and outcome are measured simultaneously, it is often impossible to determine the temporal sequence of events. Did the exposure lead to the outcome, or did the outcome lead to the exposure? This is often called the temporality problem or the "chicken and egg" dilemma.
A second major issue is related to measuring prevalence instead of incidence. Prevalent cases are, by definition, survivors. People who have a disease for a long time are more likely to be included in a cross-sectional study than those who recover quickly or die rapidly. This can distort the relationship between an exposure and a disease, a phenomenon known as prevalence-incidence bias or Neyman bias.
The following video provides an excellent, in-depth explanation of these limitations using a real-world data example that produces a counterintuitive finding.
Week 5 : CROSS SECTIONAL STUDIES
This video from the "Data Learner" channel uses data from the famous Framingham Heart Study to illustrate why interpreting associations from cross-sectional data is so challenging.
Watch from the beginning of the interpretation discussion. The presenter shows that the prevalence of heart disease is lower in smokers than non-smokers and then masterfully dissects the three possible explanations for this finding: Incidence: Is smoking actually protective? (He shows this is false by looking at incidence data). Duration of Disease: Do smokers who get heart disease die sooner, thus removing them from the pool of prevalent cases? This is a classic example of survival bias. Reverse Causation: Do people who get diagnosed with heart disease quit smoking? Here, the disease influences the exposure, not the other way around.
As the video powerfully demonstrates, an association found in a cross-sectional study has several plausible explanations. The observed association is a mix of factors related to risk (incidence) and factors related to survival (duration). Disentangling these is impossible within the confines of the study itself.
To formalize the terms from the video, let's look at one more resource.
This educational handout from the University of North Carolina provides precise definitions for the biases we've just discussed.
Please read the section Limitations of cross-sectional studies to evaluate risk. Focus on the definitions provided for: Survival bias, which is the issue of prevalence being influenced by both incidence and duration of disease. Antecedent-consequent bias, which is the formal term for the "chicken and egg" temporality problem.
Conclusion
In this lesson, we took our first step into the world of observational study designs by examining the cross-sectional study. It is a workhorse of epidemiology, valued for its efficiency and utility in public health planning.
Here are the essential takeaways:
- Design: A cross-sectional study is a "snapshot" that measures exposures and outcomes in a defined population at a single point in time.
- Primary Use: It is ideal for measuring the prevalence of diseases and risk factors.
- Strengths: It is relatively fast, inexpensive, and good for generating hypotheses about potential associations.
- Key Limitations: Its greatest weakness is the inability to determine temporality (did the exposure precede the outcome?). Furthermore, the findings can be distorted by survival bias, as prevalent cases are not necessarily representative of all cases.
Because of these limitations, cross-sectional studies are generally considered poor for making strong claims about causation. To do that, we need a study design that can establish that the exposure came before the outcome.
In our next lesson, we will explore precisely such a design: the cohort study, where we follow individuals forward in time to see who develops the disease.