Welcome back! In our previous lesson, you learned how to create and visually interpret Kaplan-Meier survival curves in R. We generated a comprehensive plot that included a p-value from a log-rank test, which hinted at a statistically significant difference between the survival of male and female patients in our dataset.
Today, we will dive into that p-value. This lesson focuses on the log-rank test, the statistical method used to formally compare survival distributions between two or more groups. You'll learn the theory behind the test, how to perform it using R, and, most importantly, how to interpret its results to draw meaningful conclusions. This will solidify your ability to move from visual inspection of curves to rigorous statistical comparison.
What Question Does the Log-Rank Test Answer?
When we look at two Kaplan-Meier curves, like the ones for males and females from our last session, they might appear different. But is that difference "real" in a statistical sense, or could it have just occurred by chance? The log-rank test provides a formal way to answer this.
Its core purpose is to test a specific hypothesis about the survival distributions of the groups being compared. The following article provides a very clear, non-mathematical explanation of this.
Easy log rank test for survival analysis - biostatsquid.com
This article from biostatsquid.com gives an excellent, intuitive overview of the log-rank test.
Please start by reading the section What is the log rank test? to understand its main purpose. Then, jump to the section Hypotheses in the log rank test to see the core question the test answers, reading from the definition of the hypotheses down to the summary box.
The key hypotheses are:
- Null Hypothesis (): There is no difference in survival between the groups. The survival curves are identical in the populations from which the samples were drawn.
- Alternative Hypothesis (): There is a difference in survival between the groups. The survival curves are not identical.
This can be visualized quite simply. Under the null hypothesis, the curves for different groups would essentially overlap. Under the alternative hypothesis, they would be distinct.

The Intuition: Observed vs. Expected Events
So, how does the test decide between these two hypotheses? You don't need to perform the calculations by hand, but understanding the logic is crucial for interpretation, especially given your interest in the "why" behind the methods.
At its heart, the log-rank test is a type of chi-square test. For each time an event (e.g., a death) occurs, the test calculates:
- The observed number of events in each group.
- The expected number of events in each group, assuming the null hypothesis is true (i.e., assuming the risk is the same for everyone, regardless of group).
It then sums these observed and expected counts across all event times and compares them. If the total observed events in each group are very different from what was expected, this suggests the null hypothesis is wrong. The chi-square statistic quantifies this difference, which is then converted into a p-value.
Let's read a brief, intuitive summary of this process.
Easy log rank test for survival analysis - biostatsquid.com
Let's get an intuitive feel for how the test works without getting bogged down in equations. This same article explains it well.
Read the section How is the log rank test calculated?. Focus on the text that explains the logic: the core idea is about comparing observed vs. expected events at each event time.
If you are curious to see a step-by-step numerical example of this observed vs. expected calculation, the following optional video provides a great walkthrough.
Kaplan-Meier Curves and Log-rank Test - [Survival Analysis 4/8]
(Optional) If you'd like to see how the observed vs. expected calculation is done with a small example, this video from the zedstatistics channel walks through it manually.
Watch the section from the start of the log-rank test explanation up to the conclusion of the manual calculation. This will solidify the concept of comparing what you observed with what you'd expect if the curves were identical.
Performing the Log-Rank Test in R
In R, the primary function for this test is survdiff() from the survival package. Its structure is very similar to the survfit() function you're already familiar with.
Let's revisit the lung dataset and formally test the difference in survival between males and females that we plotted in our last lesson.
27 Survival analysis - The Epidemiologist R Handbook
The Epidemiologist R Handbook shows the R implementation for the log-rank test very clearly.
In the section Comparison of survival curves, read the part on the Log rank test. Focus on the explanation of the survdiff() function. Then, look at the code example that uses it to compare survival by gender. Note that their example uses a different dataset, but the function call is what matters.
Now, let's apply this to our lung data.
# Load libraries if not already loaded
library(survival)
library(survminer)


# Perform the log-rank test comparing survival by sex
# The formula `Surv(time, status) ~ sex` is the same one we used for plotting
logrank_test_sex <- survdiff(Surv(time, status) ~ sex, data = lung)


# Print the results
print(logrank_test_sex)
This produces the following output:
Call:
survdiff(formula = Surv(time, status) ~ sex, data = lung)

        N Observed Expected (O-E)^2/E (O-E)^2/V
sex=1 138      112     91.4      4.65      10.3
sex=2  90       53     73.6      5.77      10.3

 Chisq= 10.3  on 1 degrees of freedom, p= 0.001
Interpreting the Output
Let's break down this output piece by piece:
- N: The number of subjects in each group (138 males, 90 females).
- Observed: The actual number of events (deaths) observed in each group. We saw 112 deaths among males and 53 among females.
- Expected: The number of deaths we would have expected in each group if the null hypothesis were true. We expected 91.4 deaths for males but saw 112. We expected 73.6 for females but saw only 53. This discrepancy is the evidence against the null hypothesis.
- (O-E)^2/E: A component of the chi-square calculation for each group.
- Chisq= 10.3: The overall chi-square test statistic, which summarizes the total difference between observed and expected counts across both groups.
- on 1 degrees of freedom: The degrees of freedom is the number of groups minus 1 (i.e., 2 - 1 = 1).
- p= 0.001: This is the final result. It is the probability of observing a difference this large (or larger) between the survival curves if there were truly no difference in the populations.
Since our p-value (0.001) is much smaller than the conventional significance level of 0.05, we reject the null hypothesis. We can conclude that there is a statistically significant difference in survival time between males and females in this dataset.
The following resource provides a concise guide to interpreting p-values from this test.
Easy log rank test for survival analysis - biostatsquid.com
Now let's formally interpret the p-value we got from R. The biostatsquid article has a great summary for this.
Read the section How to interpret log rank test results, focusing on the two possible outcomes based on the p-value. Pay close attention to the careful wording used for a non-significant result.
As you saw in the previous lesson, the ggsurvplot function can run this test for you and add the p-value directly to the plot by setting pval = TRUE. This is often the most efficient workflow, as it combines the formal test with the visualization.
Comparing More Than Two Groups
The log-rank test is not limited to two groups. We can use it to compare three or more groups simultaneously. For example, let's compare survival across different physician-rated ECOG performance scores (ph.ecog) in the lung dataset.
The hypotheses are slightly different in this case:
- Null Hypothesis (): The survival curves for all groups are identical.
- Alternative Hypothesis (): At least one of the survival curves is different from the others.
A significant p-value tells you that the groups are not all the same, but it does not tell you which specific groups differ from each other (similar to an ANOVA F-test in regression).
# Perform a log-rank test for the ph.ecog variable (ECOG performance score)
# Note: some values are missing, so we'll filter them out first.
lung_filtered <- lung[!is.na(lung$ph.ecog), ]

logrank_test_ecog <- survdiff(Surv(time, status) ~ ph.ecog, data = lung_filtered)

print(logrank_test_ecog)
Call:
survdiff(formula = Surv(time, status) ~ ph.ecog, data = lung_filtered)

             N Observed Expected (O-E)^2/E (O-E)^2/V
ph.ecog=0   63       37     52.3      4.52      6.47
ph.ecog=1  113       82     87.3      0.32      0.65
ph.ecog=2   51       44     27.1     10.56     14.88
ph.ecog=3    1        1      0.3      1.59      1.61

 Chisq= 21.8  on 3 degrees of freedom, p= 7e-05
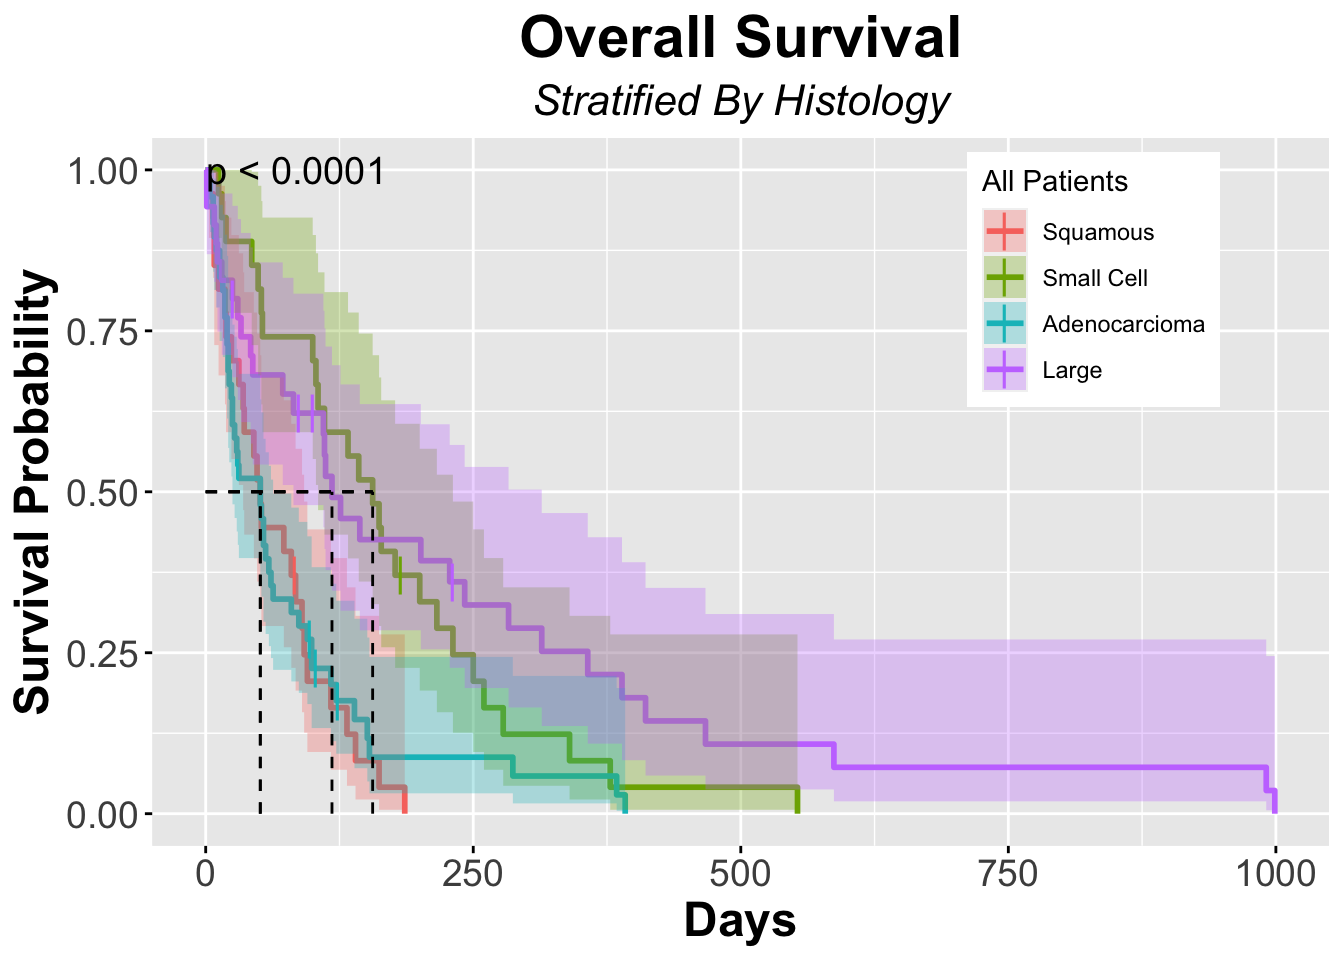
The very small p-value (p= 7e-05, or 0.00007) indicates a highly significant difference in survival among the different ECOG performance score groups. Looking at the plot gives us the visual context for this result.
Limitations and Looking Ahead
The log-rank test is a fundamental tool, but it has two key limitations:
- It tells you if a difference exists, but it doesn't quantify the size of that difference (e.g., how much better is survival in one group compared to another?).
- It's a simple comparison of groups and cannot adjust for other variables (confounders). For example, if one treatment group is older on average than another, the log-rank test can't separate the effect of the treatment from the effect of age.
Easy log rank test for survival analysis - biostatsquid.com
The log-rank test is powerful, but it's important to know its limits.
Read the short section Is the log rank test enough? This provides the perfect motivation for our next topic.
These limitations bring us directly to the need for a more powerful tool: regression modeling for survival data.
Conclusion
In this lesson, you've moved beyond visual inspection to statistically test the differences between survival curves. You now understand the conceptual basis of the log-rank test and can confidently perform and interpret it in R.
Here are the main takeaways:
- The log-rank test is a hypothesis test that formally compares survival distributions among two or more independent groups.
- The null hypothesis states that there is no difference in survival between the groups.
- The test works by comparing the observed number of events to the expected number of events under the null hypothesis.
- In R, the
survdiff()function performs the test, and its primary output for interpretation is the p-value. - A significant p-value indicates that at least one group's survival distribution is different from the others, but it does not quantify the size of the effect or adjust for confounders.
The limitations of the log-rank test perfectly set the stage for our next lesson, where we will explore the Cox Proportional Hazards Model. This regression model will allow us to not only compare groups but also to estimate the magnitude of the effect (the Hazard Ratio) and adjust for multiple covariates simultaneously.