Introduction
In our previous lesson, we explored the broader philosophical debate between the Efficient Markets Hypothesis and Behavioral Finance. We saw how these theories provide competing frameworks for understanding asset prices. Today, we will narrow our focus to a specific, yet fundamentally important, area of the market: the relationship between interest rates and time, known as the term structure of interest rates.
This lesson will address the learning outcome: Explain the factors driving the term structure of interest rates and their impact on actuarial liabilities. We will approach this in two parts. First, we will examine the main theories that seek to explain the shape of the yield curve—the graphical representation of the term structure. Second, and most critically for an actuary, we will investigate how changes in this curve directly impact the valuation of long-term liabilities, forming a cornerstone of Asset-Liability Management (ALM).
Given your strong foundation from the CM-series exams, we will move quickly past the basic definitions and focus on the conceptual underpinnings and their practical implications for an actuary.
Part 1: Deconstructing the Yield Curve
The term structure of interest rates, or yield curve, illustrates the yields on bonds of similar quality across a range of different maturities. The shape of this curve—whether it is upward-sloping (normal), downward-sloping (inverted), or flat—provides a wealth of information about market expectations for inflation, economic growth, and future monetary policy.
To begin, it is helpful to distinguish between two key types of interest rates that form the building blocks of the yield curve: spot rates and forward rates.
CT1 Chapter 14 Term Structure of Interest Rates Part 1. (Actuarial Science)
The video "CT1 Chapter 14 Term Structure of Interest Rates Part 1" from MJ the Fellow Actuary provides clear, actuarially-focused definitions of these concepts.
Please watch the first few minutes to refresh your understanding of: Spot rates, which are the rates for an investment made today for a specific duration (spot rate explanation). Forward rates, which are rates agreed upon today for an investment that will begin at a future date (forward rate explanation).
The relationship between these spot and forward rates mathematically determines the yield curve's shape. Economists and financial practitioners have developed several theories to explain why this relationship exists and what it signifies.
Theories of the Term Structure
There are four primary theories that attempt to explain the shape of the yield curve. They are not mutually exclusive and, in reality, the true behavior of interest rates is likely a combination of all four.
Let's begin by watching a video that outlines these theories. The presenter uses the helpful acronym LIME (Liquidity, Inflation, Market Segmentation, Expectation).
CT1 Chapter 14 Term Structure of Interest Rates Part 1. (Actuarial Science)
Continuing with the same video, the presenter clearly explains the four main theories that drive the shape of the term structure.
Please watch the segment from where he introduces the four theories. As you watch, focus on the core logic behind each one: Liquidity Preference Theory: Why do investors demand higher rates for longer-term loans? Inflation: How do expectations about future inflation influence longer-term rates? (Note: This is often considered a key component within the Expectations and Liquidity theories). Market Segmentation Theory: How do the differing needs of market participants (e.g., banks vs. pension funds) create distinct markets for different maturities? Expectations Theory: How are long-term rates related to expected future short-term rates?
Now, let's solidify these concepts with a concise written summary, which will also be useful for your revision.
Traditional Theories of the Term Structure of Interest Rates
This article from AnalystPrep provides clear, distinct definitions for each theory.
Please read the sections on the Unbiased Expectations Theory, Liquidity Preference Theory, Preferred Habitat Theory, and Market Segmentation Theory. Pay attention to how each theory contributes to the final shape of the yield curve. Note that the "Preferred Habitat Theory" is a modification of the strict Market Segmentation theory, allowing for investors to move from their preferred maturity if the compensation is high enough.
To bring these ideas together, let's look at a visual summary.
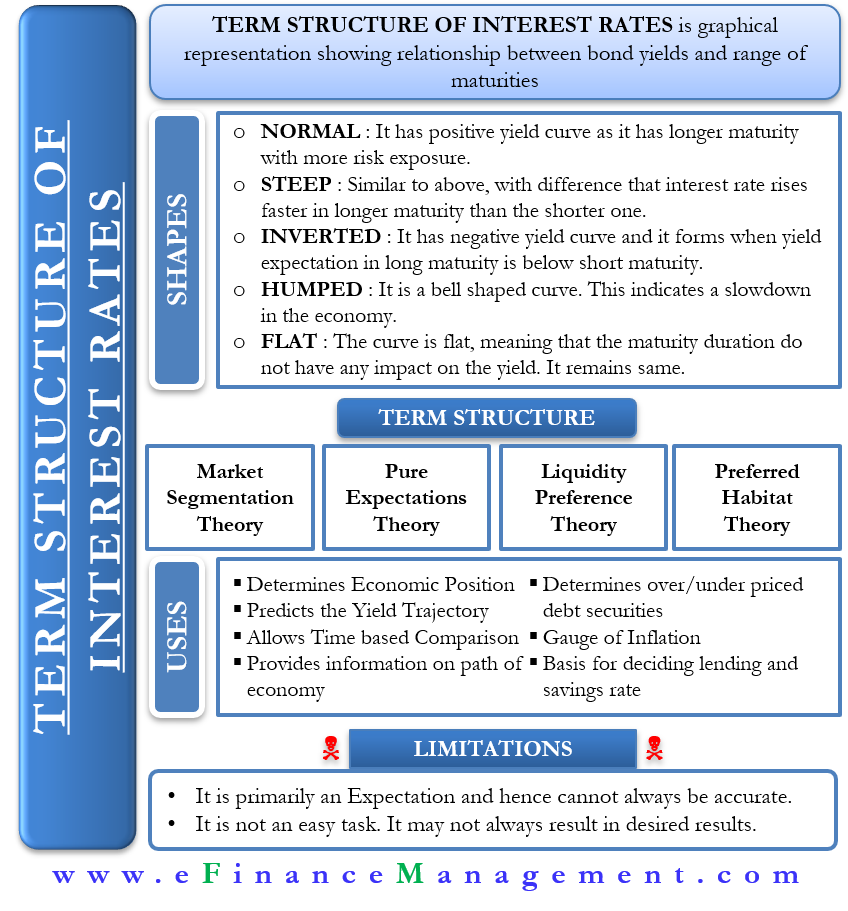
In essence:
- Expectations Theory provides the baseline: the curve's slope reflects the market's consensus on future interest rate movements.
- Liquidity Preference Theory adds an upward bias: investors generally require a premium to lock money away for longer, which helps explain why the yield curve is usually upward sloping.
- Market Segmentation & Preferred Habitat Theories add realism: the curve isn't perfectly smooth because different types of investors create supply and demand pressures at specific maturity points.
Part 2: Impact on Actuarial Liabilities
Understanding these theories is intellectually interesting, but for an actuary, the critical question is: "Why does this matter for my work?"
The answer is that the value of an insurer's or pension fund's liabilities is highly sensitive to the level and shape of the term structure. These liabilities are essentially a series of long-term future cash flows (pension payments, life insurance claims). To find their present value, we must discount them using an appropriate set of interest rates from the yield curve.
The primary tool for measuring this sensitivity is duration. As you know from your prior studies, duration is a weighted-average measure of the timing of an asset's or liability's cash flows, and it serves as a first-order approximation of its price sensitivity to a change in interest rates.
Let's watch a video that connects the concept of duration to Asset-Liability Management.
Risk Management for Changing Interest Rates: Asset-Liability Management and Duration Techniques
The video "Risk Management for Changing Interest Rates" by AnalystPrep offers a clear explanation of duration and its application in managing net worth.
Please watch the following segments: First, review the definition of duration as an effective time to maturity. Next, watch the section on the duration gap and its impact on a firm's net worth. This demonstrates how a mismatch between the duration of assets and liabilities exposes the balance sheet to interest rate risk.
The video illustrates a crucial point: an institution's net worth (or surplus) is vulnerable to interest rate changes if the duration of its assets does not appropriately match the duration of its liabilities.
For an actuary, this has profound implications. A life insurer with 30-year annuity liabilities and assets primarily invested in 5-year bonds has a significant duration mismatch. If interest rates fall, the value of its liabilities will increase by much more than the value of its assets, potentially eroding or eliminating its surplus.
The IAA Risk Book provides an excellent professional perspective on this.
[PDF] IAA Risk Book Asset Liability Management Techniques and ...
This document discusses the practical challenges of ALM for insurance companies.
Please read the following sections: Start with the Introduction in Section 2, which highlights why interest rate risk is so central to life insurers with long-duration liabilities. Then, move to Section 4.1.1 on Interest Rate Risk. Focus on how risk manifests (market value, economic, accounting) and the discussion on non-parallel shifts in the yield curve.
The reading highlights several key points for a practicing actuary:
- Duration is not enough. Standard duration measures sensitivity to a parallel shift in the yield curve, where all rates move by the same amount. However, yield curves can also twist, steepen, or flatten. A portfolio might be duration-matched for a parallel shift but still suffer large losses from a non-parallel shift. This is why more advanced metrics like partial duration (or key rate duration) are used to measure sensitivity to changes at specific points along the curve.
- Embedded Options. Many assets and liabilities contain options that make their cash flows interest-rate-sensitive. For example, policyholders might be more likely to surrender a policy when rates rise (a lapse risk). These behaviors change the effective duration and convexity of liabilities and must be modeled.
- Data Quality. All this analysis depends on having a reliable yield curve to begin with. In practice, constructing a curve, especially for very long maturities, is fraught with challenges.

Conclusion
In this lesson, we established that the term structure of interest rates is shaped by a combination of market expectations, investor preferences for liquidity, and the specific needs of different market participants. We explored the main theories that explain these dynamics.
More importantly, we connected these financial theories to actuarial practice. The level and shape of the yield curve are a primary driver of the value of an institution's long-term liabilities. An actuary's role in Asset-Liability Management is to understand, measure, and manage the risk arising from changes in the term structure. Duration is the fundamental tool for this, but a sophisticated practitioner must also account for non-parallel shifts, embedded options, and the practical challenges of modeling the curve itself.
Key Takeaways & Cheatsheet:
Part 1: Theories of the Term Structure
| Theory | Core Idea | Implication for Yield Curve Shape |
|---|---|---|
| Pure Expectations | Forward rates are unbiased predictors of future spot rates. | Shape depends entirely on expected future interest rates (upward if rates expected to rise). |
| Liquidity Preference | Investors demand a premium for lending long-term due to higher risk and less liquidity. | Tends to create an upward slope, as a "liquidity premium" is added to expected rates. |
| Market Segmentation | Supply and demand in distinct maturity segments (habitats) determine rates. | Can explain humps or kinks in the curve that other theories cannot. |
| Preferred Habitat | A blend: investors have preferred maturities but can be enticed to others by higher yields. | Allows for both market segmentation effects and the influence of expectations. |
Part 2: Impact on Actuarial Liabilities
| Concept | Description | Actuarial Relevance |
|---|---|---|
| Liability Valuation | Long-term liability cash flows are valued by discounting them at rates from the yield curve. | A fall in interest rates increases the present value of liabilities. A rise in rates decreases it. |
| Duration | The primary measure of the sensitivity of an asset or liability's value to interest rate changes. | Used to quantify the interest rate risk of the balance sheet. A duration gap (Duration of Assets ≠ Duration of Liabilities) exposes the firm's surplus to risk. |
| Non-Parallel Shifts | The yield curve twisting, steepening, or flattening, rather than shifting up or down uniformly. | A portfolio can be duration-matched for parallel shifts but still lose value in a twist. This necessitates more advanced risk measures like partial durations (key rate durations). |
| ALM Objective | To manage assets in a way that the firm can meet its liabilities under various scenarios. | A core part of this is managing the duration gap and other interest rate exposures to protect the firm's surplus and solvency. |
In our next lesson, we will build on this foundation by discussing the practical application and limitations of discounted cashflow (DCF) valuation methods in an actuarial context. This will involve a deeper look at how we actually use these interest rates to value complex assets and liabilities.