Hello! Welcome back to the course.
In our last lesson, we gave our copilot powerful new capabilities by extending it with plugin actions, allowing it to move beyond just answering questions to actively performing tasks. We now have a copilot that can understand intent, provide information from knowledge bases, and execute actions via custom connectors and Power Automate flows.
This is analogous to the development phase in a traditional software project. Now, we move to the crucial next phases: testing, debugging, and deployment. This lesson bridges the gap between building your copilot and delivering it to your end-users. We will cover how to test, debug, and publish a chatbot to a channel like a custom website. Mastering this lifecycle is essential for building reliable, enterprise-grade copilots and is a key topic for your PL-400 certification.
1. The Iterative Cycle: Test and Debug
Just like any application you develop, a copilot requires rigorous testing. Copilot Studio provides a suite of tools that facilitate an iterative test-and-debug cycle.
The Test Pane and Demo Website
Your first line of defense is the Test pane directly within the authoring canvas. It allows for quick, immediate checks of your topics and actions as you build them. However, for more thorough testing or for sharing with stakeholders, you have two better options:
- Demo Website: Copilot Studio automatically generates a standalone, shareable demo website. This is perfect for internal testing and getting feedback from teammates without giving them access to the authoring canvas.
- Tracking between topics: Within the test pane, you can enable "tracking between topics." This feature provides a real-time, visual representation of the conversation flow, showing which topics and nodes are being triggered. For a developer like yourself, this is conceptually similar to setting a breakpoint and stepping through code.
Let's watch a brief video that demonstrates the process of publishing a copilot and then testing it on the demo website.
Copilot Studio Beginner to Pro | Full AI Chatbot Course 🤖💻
This video from Pragmatic Works will show you the final step of publishing your copilot and how you can interact with it on the pre-built demo website.
Watch from 01:09:24 to 01:13:53. Pay attention to: The importance of the Publish button to make any changes live. How to access the demo website to interact with the copilot outside the authoring canvas. The experience of testing various topics in this more realistic environment.
Deep Dive into Debugging: Activity Monitoring
While the Test pane is great for quick checks, you need a more powerful tool to diagnose complex issues, especially after the copilot has been used. This is where Activity Monitoring comes in. It's the equivalent of application logging and performance monitoring in the .NET world.
The "Review agent activity" documentation provides a comprehensive overview of these capabilities. Let's break it down.
This Microsoft Learn article is your primary guide to debugging in Copilot Studio. We will go through it section by section.
Please read the introduction and the sections on 'Real-time activity map during testing' and 'Historical activity'. Focus on understanding the difference between real-time debugging during a test session and reviewing historical session data. Notice the data residency implications mentioned for historical data.
As you've read, there are two main ways to use activity monitoring:
- Real-time Activity Map: This visualizes the AI's "plan" as you test your copilot. It shows which actions were considered, which were chosen, and the inputs/outputs for each step. This is invaluable for debugging plugin actions, as you can see exactly what data was passed and received.
- Historical Activity: This is your log file for all past conversations (from the test pane, demo site, and published channels). You can review every session to understand user interactions, identify failures, and analyze performance.
Now, let's explore how to navigate and interpret this historical data.
Continuing with the same article, let's look at the specifics of the historical activity views.
Read the remaining sections: 'Session list', 'View session activity', 'View all agent activity in the activity map', and 'Agent status'. Pay close attention to: How to customize the session list to find specific conversations. The 'Transcript + Map' view, which combines the chat log with a visual flow diagram. The 'Rationale' feature, which explains why the AI chose a specific tool—a powerful concept for debugging intelligent systems. The different agent statuses, which help you quickly identify successful versus failed sessions.
Test your understanding!
A user reports that when they asked your copilot to "update my order to shipped," the request failed. In the previous lesson, you built a plugin action UpdateOrderStatus which requires orderId and newStatus.
Using the Activity Monitoring tools, what would be your debugging process to identify the root cause?
Show answer
- Locate the Session: Go to the 'Activity' page and find the user's failed session. You might filter by user name or date. The 'Failed' status would be a strong indicator.
- Review the Transcript and Map: Open the session in the 'Transcript + Map' view. In the transcript, confirm the user's exact phrasing.
- Inspect the Action Node: In the activity map, locate the node corresponding to the
UpdateOrderStatusplugin action. It will likely be colored red to indicate an error. - Analyze Inputs: Select the action node to inspect its details. Check the 'Inputs' section. You would likely find that the
newStatusparameter was correctly identified as "shipped," but theorderIdparameter is missing or empty, as the user never provided it. - Check the Rationale: Use the 'Show rationale' feature on the node to confirm that the AI correctly identified the intent to call
UpdateOrderStatusbut was missing a required parameter. This confirms the failure was due to missing information, not an incorrect action being chosen.
The root cause is that the user's request was incomplete. The fix might involve improving the description of the orderId parameter in the plugin action definition to help the copilot prompt the user more effectively when it's missing.
2. Going Live: Publishing to Channels
Once you are confident that your copilot is working correctly, it's time to publish it for your users. In Copilot Studio, you deploy your agent to one or more channels.
While you can publish to many channels like Microsoft Teams or Facebook, a very common requirement is to embed the copilot into an existing company portal or public website. This is the focus of our final section.
Publishing to a Custom Website
Your background in HTML and JavaScript will be very useful here. The process involves embedding an HTML snippet into your web page. This snippet contains a div element to host the chat canvas and a script block that handles the connection to your copilot.
This process requires two key pieces of information from Copilot Studio:
- Web channel secret: A key that authenticates your website with the Direct Line channel, ensuring only authorized clients can connect.
- Bot ID: The unique identifier for your copilot.
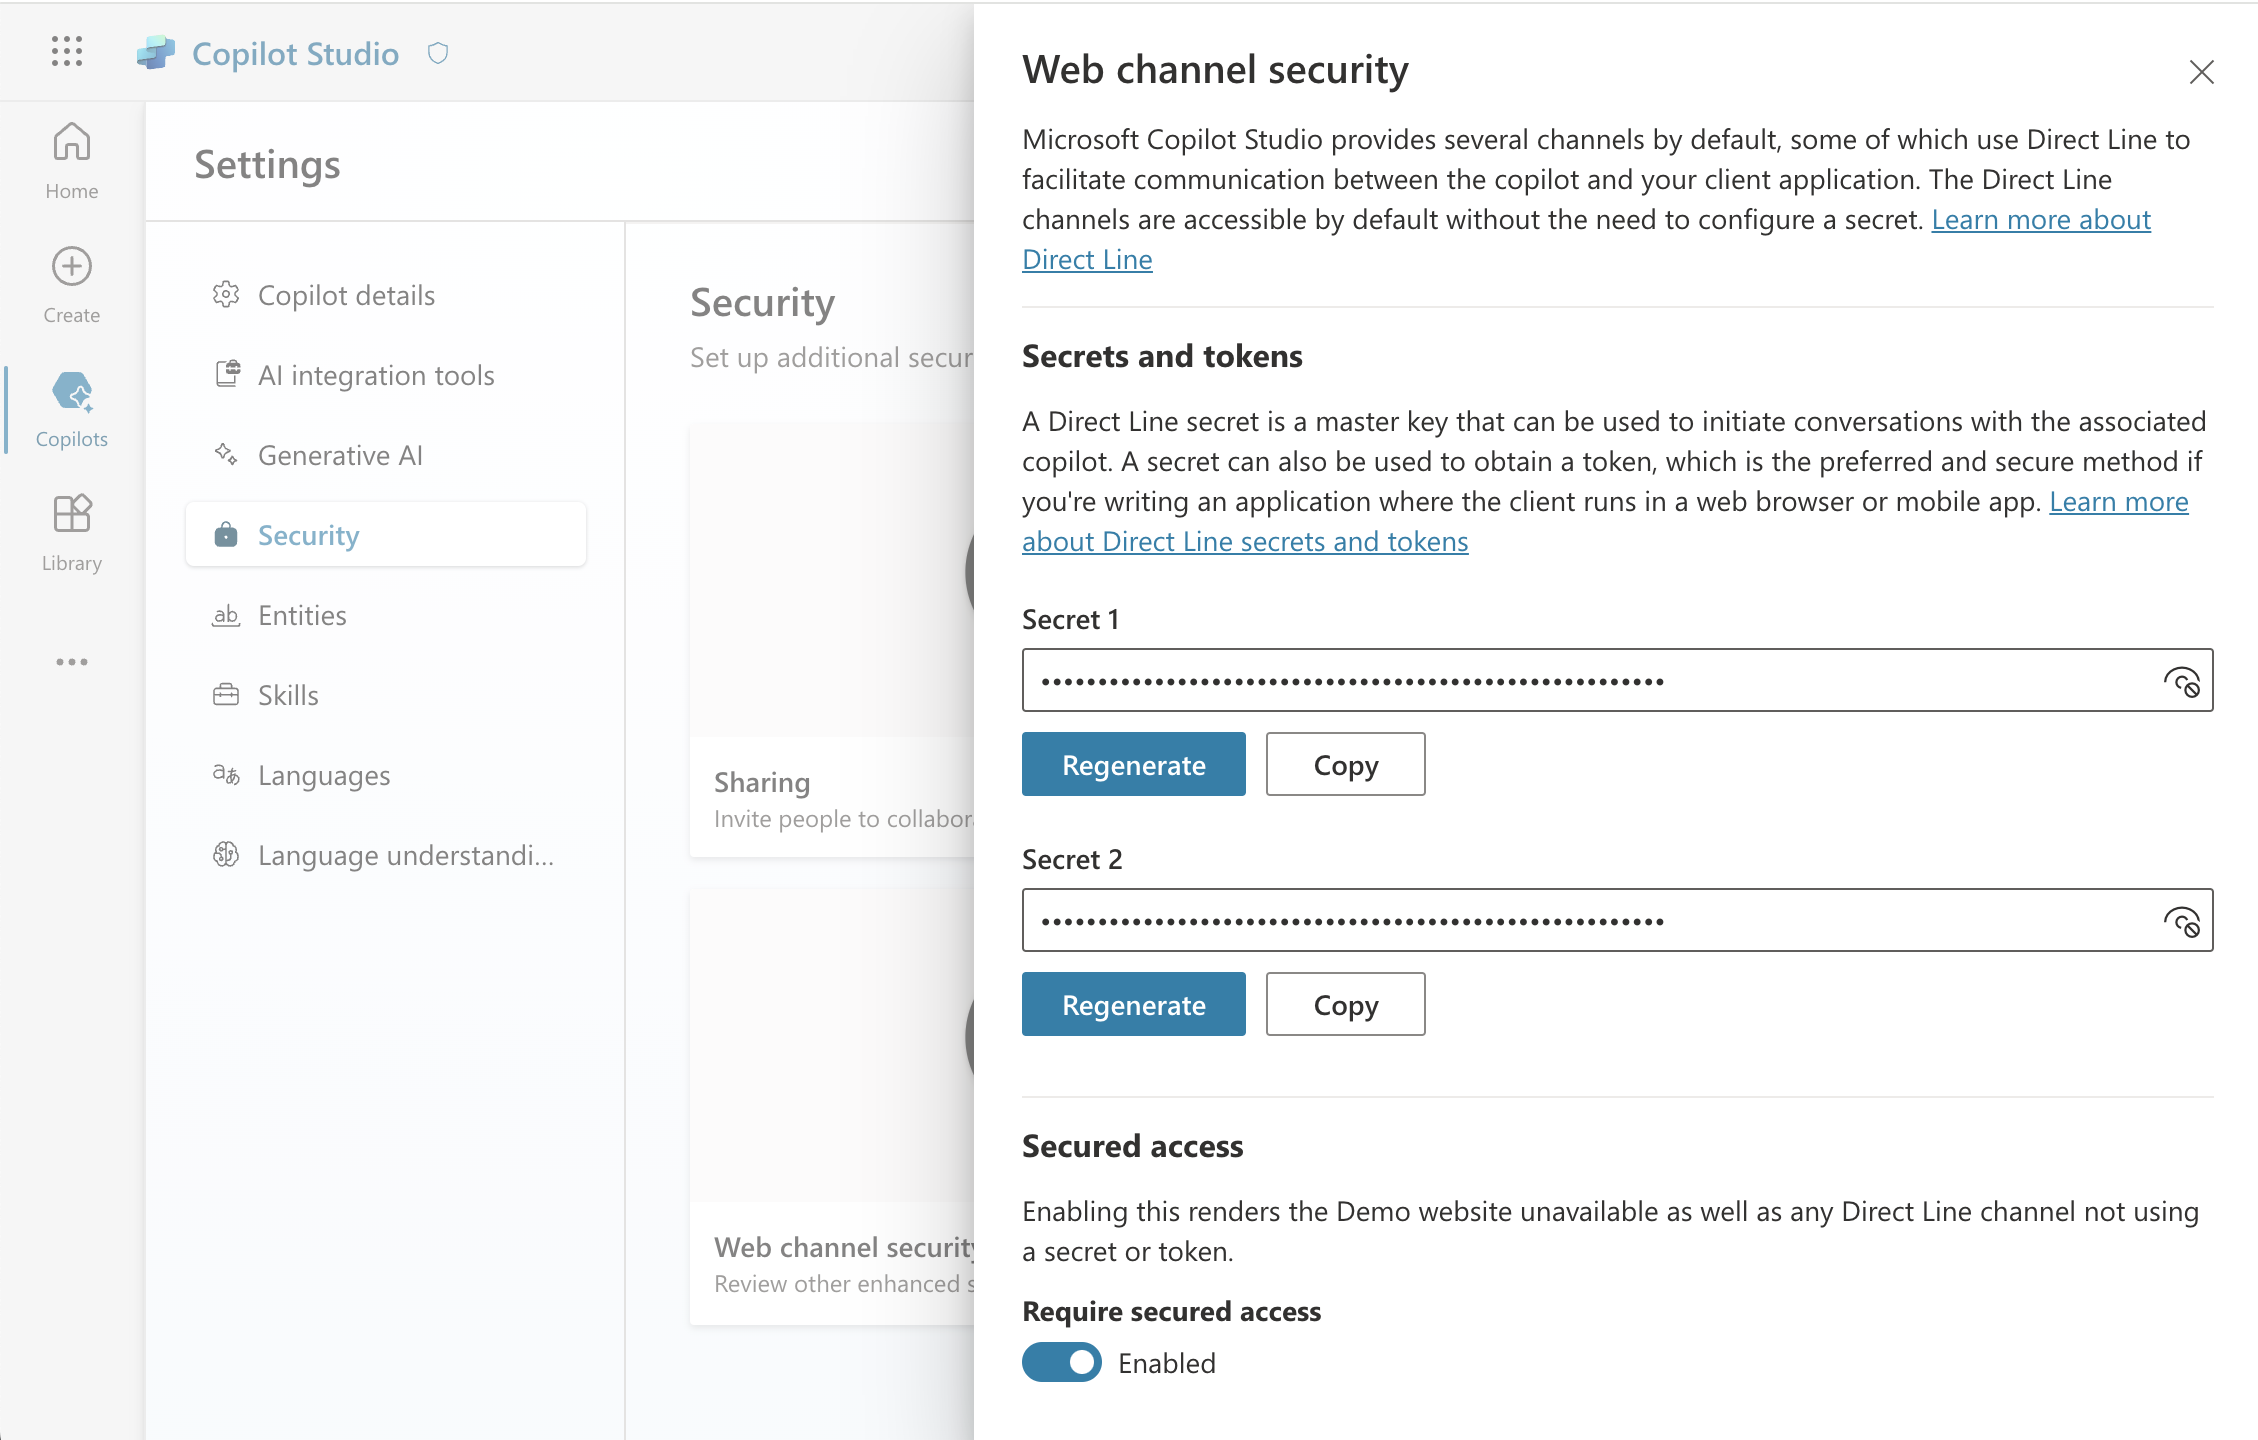
The following Microsoft Learn article provides the exact code and steps needed.
Publish an agent to a live or demo website
This guide provides the practical code snippet and instructions to embed your copilot into a custom webpage. This is a core skill for the PL-400 exam.
Focus on the section 'Add your agent to your website'. Examine the HTML snippet: Notice the div with the ID webchat and the script tag that references the Bot Framework Web Chat library. Identify the key variables: In the script, locate the tokenEndpoint and botId variables. You will need to replace the placeholder values with the actual values from your copilot's settings. Understand the flow: The script fetches a temporary token from the tokenEndpoint using your secret, then uses that token to initialize the web chat control, connecting it to your specific bot. This is a standard and secure pattern for client-side applications.
To get the tokenEndpoint, you navigate to Settings > Channels > Microsoft Teams > Availability options. Copy the Bot ID. Then, the token endpoint URL is structured as: https://directline.botframework.com/v3/directline/tokens/generate. Your code will need to make a POST request to this endpoint with your Direct Line secret in the Authorization header to get a token.
For a simpler approach that uses a pre-built iframe, you can go to Channels > Custom website and copy the provided HTML code snippet, which already includes your Bot ID. You simply paste this into your HTML file. This is the most straightforward method.
Conclusion
In this lesson, you've completed the full development lifecycle for a copilot: building, testing, debugging, and publishing. You now have a complete framework for creating and deploying robust, enterprise-ready conversational AI solutions.
Key Takeaways:
- Testing is iterative: Use the Test pane for quick checks and the Demo website for broader testing and stakeholder feedback.
- Debugging uses logs and traces: The Activity Monitoring page, with its session transcripts and visual activity maps, is your primary tool for diagnosing issues, much like analyzing logs in traditional development. The 'Rationale' feature provides unique insight into the AI's decision-making process.
- Publishing makes it live: The Publish button deploys your changes. You can make your copilot available on various channels.
- Embedding in a website is straightforward: You can embed your copilot into any custom website by using a simple HTML snippet and securing the connection with a Direct Line secret.
What's Next?
We've now completed our deep dive into Microsoft Copilot Studio. In the next module, we will shift our focus to another powerful component of the Power Platform: AI Builder. In the upcoming lesson, you will learn how to select the appropriate AI Builder model type for a given business problem. We will explore pre-built and custom models for tasks like form processing, object detection, and prediction, opening up a new range of intelligent automation possibilities.