Hello! Welcome back to our journey toward the PL-400 certification.
In our last lesson, we designed three powerful patterns for synchronizing data between Dataverse and Azure SQL. We saw how to use Virtual Tables for real-time access, Azure Data Factory for complex migrations into Dataverse, and Azure Synapse Link for efficient exports to SQL. Building these integrations is a critical skill, but ensuring they are reliable and performant in a production environment is just as important.
Today, we address that need directly. Your learning outcome is to monitor and troubleshoot integrations using Application Insights and Azure Monitor. We'll explore how to instrument the various components of a Power Platform solution to send telemetry to a central location, and then how to use powerful analytical tools to diagnose issues, track performance, and understand user behavior. This is the key to building robust, enterprise-grade solutions.
The Foundation: Azure Monitor and Application Insights
Before we dive into the "how," let's clarify the "what." The primary monitoring services in Azure are Azure Monitor and Application Insights.
To get a clear picture of their roles, please watch this short introductory video from Microsoft.
This video, 'What is Azure Monitor?', explains how Azure Monitor acts as the central service for collecting telemetry from all your Azure resources and even on-premises environments. It will clarify the distinction between 'metrics' and 'logs', which is fundamental to everything we'll discuss today.
Watch the video from the beginning up to the 2:42 mark. Focus on understanding: The overall purpose of Azure Monitor. The types of data it collects (platform, application, etc.). The core difference between Metrics (for real-time alerting) and Logs (for complex analysis).
As you saw, Azure Monitor is the umbrella service. Application Insights is a feature within Azure Monitor, specifically designed as an Application Performance Management (APM) service. It gives us rich tools to monitor our applications, detect issues, and analyze telemetry.
To see Application Insights in action, let's watch a more detailed tutorial.
Azure Application Insights Tutorial | Amazing telemetry service
The video 'Azure Application Insights Tutorial' provides an excellent tour of the service's key features. Since our integrations often involve Azure services like Functions or Web Apps alongside Power Platform, understanding how they are monitored together is crucial.
Watch the first three sections (from 00:00 to 06:24). Pay close attention to the explanations of: What it tracks: Requests, dependencies, exceptions, page views, and custom events. Key investigative tools: The Application Map, Live Metrics Stream, and Log Analytics with Kusto Query Language (KQL).
Now that we have a solid conceptual understanding, let's get practical and connect our Power Platform components to Application Insights.
Instrumenting Your Solution for Telemetry
A key principle of modern monitoring is to have a single "pane of glass" where you can see telemetry from all parts of your application. To achieve this, we'll create one Application Insights resource in Azure and configure our various components—plugins, apps, and Azure services—to send their logs to it.
1. Connecting Server-Side Logic: Dataverse Plugins
Your extensive experience with plugin development likely involved using the ITracingService to write logs to the PluginTraceLog table in Dataverse. While useful for immediate debugging, this method has limitations: logs expire after 24 hours and are isolated from the rest of your application's telemetry.
The modern approach, which integrates perfectly with Application Insights, is to use the ILogger interface.
This article from the Dynamics community provides a fantastic guide on setting this up.
Dataverse Plugin telemetry with Azure Application Insights
This article, 'Dataverse Plugin telemetry with Azure Application Insights', walks you through the entire process of configuring and using the modern logging framework for plugins.
Please read the following sections: 'Set up insights': Follow these steps to create an Application Insights resource in Azure and then link your Power Platform environment to it via the PPAC 'Data export' feature. 'Telemetry with Application Insights': Review the C# code example. Notice how you obtain the ILogger service and use methods like logger.LogInformation and logger.LogError. This should feel familiar to standard .NET logging practices. 'Differences between ILogger and ITracing Service': The table here clearly summarizes why ILogger is superior for long-term monitoring, especially regarding data retention.
The process is straightforward:
- Create the Application Insights resource in Azure.
- Connect it in the Power Platform Admin Center (
admin.powerplatform.microsoft.com) under Data export. - Update your plugin code to use the
ILoggerinterface.
Once configured, any logs you write using ILogger in your plugins will automatically be sent to your central Application Insights instance.
2. Connecting Client-Side Logic: Canvas Apps
Just as we capture server-side events, we also need to understand what's happening on the client side in our Canvas Apps. Application Insights provides a direct integration for this.
Analyze system-generated logs using Application Insights
Microsoft's official documentation, 'Analyze system-generated logs using Application Insights', explains how to connect a Canvas App and what you can do with the data.
Please read the following sections: 'Connect your app to Application Insights': This shows the simple step of pasting the Application Insights connection string into your app's properties. 'Create custom trace events': This is the most important part. Understand how to use the Trace() function in Power Fx to send custom data (like user actions, feedback, or variable states) to Application Insights. 'Analyze custom data in Application Insights': Look at the KQL query example. This shows how you can query the custom data you sent with the Trace() function.
By simply providing the connection string, you automatically get telemetry on user sessions, devices, and browser types. More importantly, the Trace() function gives you granular control to log specific events, errors, and contextual data, which is invaluable for debugging complex user interactions.
For example: Trace("PaymentSubmitted", TraceSeverity.Information, { OrderID: varOrderID, Amount: txtAmount.Text })
3. Connecting Azure Integration Components
In our previous lesson, we discussed using Azure Data Factory and Azure Functions. A major benefit of this architecture is that these Azure services can also be configured to log to the exact same Application Insights instance, giving you a unified view. As demonstrated in the "Azure Application Insights Tutorial" video, connecting an Azure Function is typically a simple configuration step during its creation or in its settings, with no code changes required for basic telemetry.
Analysis and Troubleshooting in Application Insights
With telemetry flowing in from our plugins, apps, and Azure services, we can now use Application Insights' powerful tools to monitor and troubleshoot.
The Big Picture: Application Map
Your first stop when investigating a complex integration should be the Application Map. It automatically visualizes the components of your system and the dependencies between them, overlaying performance data and error rates.
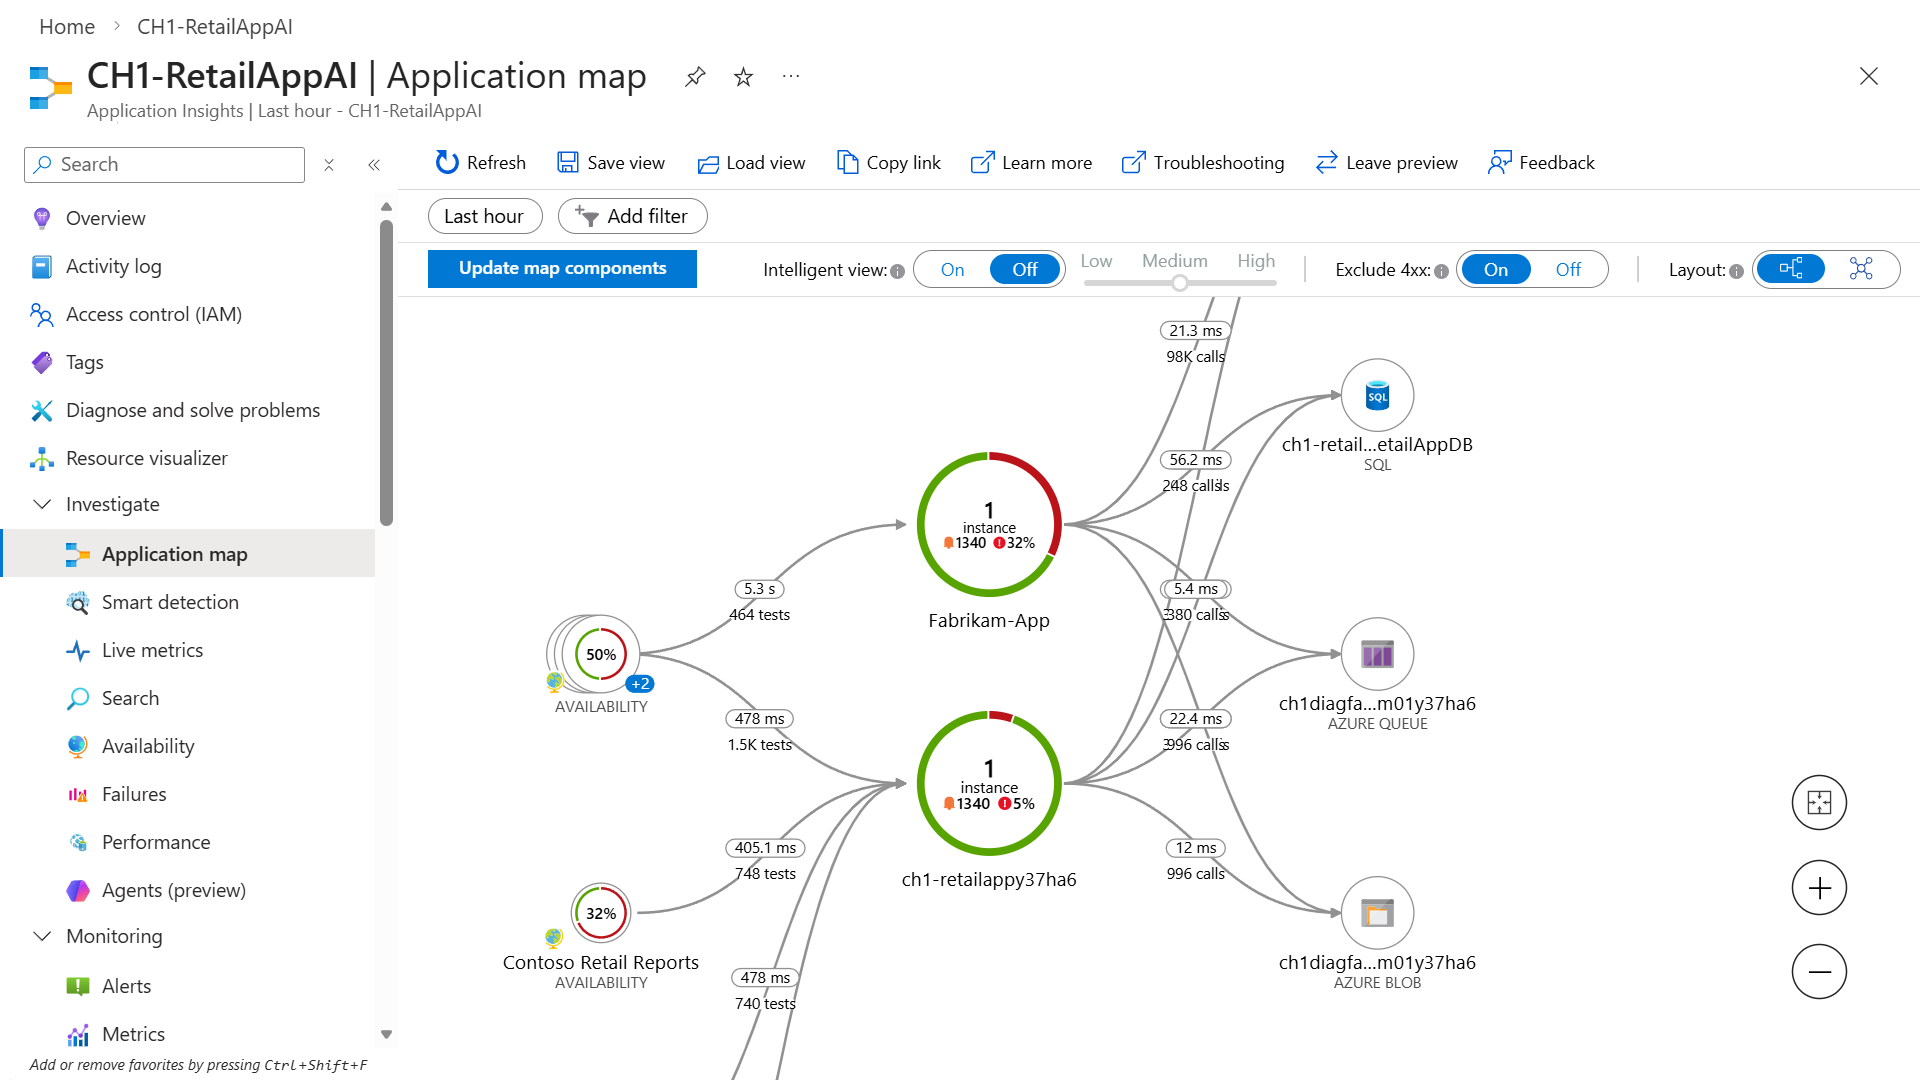
Imagine one of the data synchronization pipelines from our last lesson. An Application Map could visually represent the flow from a Dataverse plugin trigger, to an Azure Service Bus queue, to an Azure Function that processes the data and writes it to Azure SQL. A spike in errors on the Function or a high latency on the SQL call would be immediately visible.
Real-time Debugging: Live Metrics Stream
When you are actively developing or need to see what's happening right now in production, the Live Metrics Stream is your tool. It provides a real-time (sub-second latency) view of incoming requests, dependencies, and traces. It's perfect for verifying that your new plugin is firing correctly or for watching for specific errors as a user reproduces a bug.
Investigating Failures and Performance
The Failures and Performance tabs under the "Investigate" section are where you'll spend much of your troubleshooting time.
- Failures: This view aggregates all exceptions, HTTP errors, and other failures. It groups them by problem type, allowing you to focus on the most frequent issues. You can select a specific failure to see all related transactions.
- Performance: This view shows the performance of various operations and dependencies, helping you identify bottlenecks.
From either of these views, you can drill down into an "End-to-end transaction detail" view.
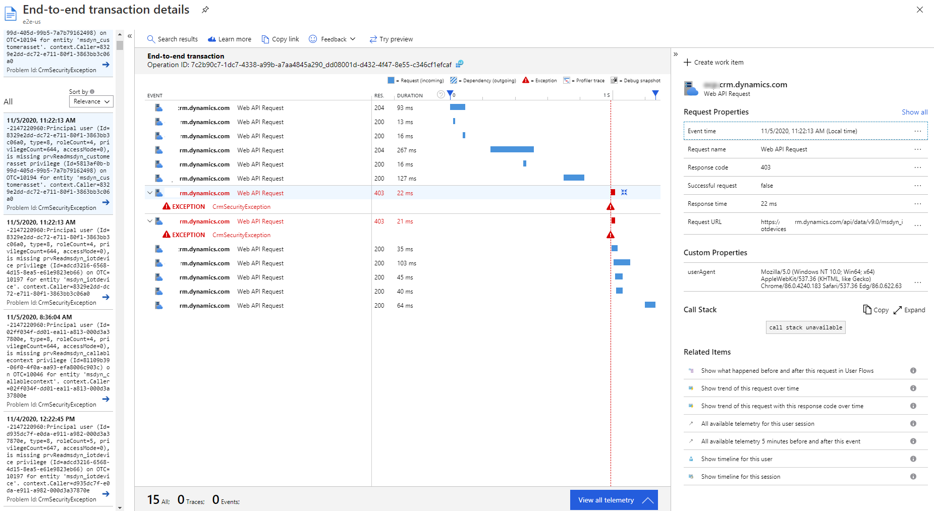
Deep Dives with Kusto Query Language (KQL)
For any question that can't be answered by the pre-built views, you have the Logs pane, which allows you to run queries against your raw telemetry data using the Kusto Query Language (KQL).
KQL is a powerful, read-only query language designed for analyzing large datasets. Its syntax is similar to SQL but with a pipe-through (|) structure that you may find reminiscent of shell command piping.
For example, to find all the custom feedback traces we sent from our Canvas App:
traces
| where message == "App Feedback"
| extend customdims = parse_json(customDimensions)
| project timestamp, AppName = customdims.['ms-appName'], FeedbackFrom = customdims.UserEmail, Screen = customdims.Screen, FeedbackValue = customdims.FeedbackValue
| order by timestamp desc
Test your understanding!
You've used logger.LogError(ex, "FollowUpPlugin failed"); in your Dataverse plugin code. What is the simplest KQL query you could write in the Logs pane to find all recorded exceptions?
Show answer
exceptions
The exceptions table in Application Insights automatically stores all telemetry logged as an exception. Simply querying this table is the starting point for investigating any error that was properly caught and logged. You can then use | where ... clauses to filter further.
Conclusion
You have now learned how to create a comprehensive monitoring strategy for your Power Platform solutions. By centralizing telemetry from Dataverse, Canvas Apps, and Azure services into Application Insights, you gain powerful capabilities for troubleshooting and performance optimization.
Key Takeaways:
- Azure Monitor is the overarching platform; Application Insights is the APM service we use for detailed analysis.
- Use the
ILoggerinterface in plugins and theTrace()function in Canvas Apps to send rich, contextual telemetry. - Always connect all components of an integration (e.g., Dataverse, Azure Functions, Web Apps) to the same Application Insights instance for unified monitoring.
- Use a systematic approach to troubleshooting:
- Start with the Application Map for a high-level overview.
- Use Live Metrics for real-time issues.
- Drill down into specific issues with the Failures and Performance tabs.
- Answer any custom question with Logs and KQL.
This knowledge is essential for moving beyond development and into the realm of building and maintaining reliable, production-ready enterprise applications.
What's Next?
We've now covered a significant portion of the integration and architecture topics in the PL-400 curriculum. The next step is to focus on professional deployment practices. In our next lesson, we will kick off the final module, "Professional ALM and DevOps," by learning how to implement connection references and environment variables for deployment flexibility across environments. This will set the stage for building automated deployment pipelines.