Hello! Welcome to the next lesson in our "Professional ALM and DevOps" module.
In our last two lessons, we established a full CI/CD process. We created a build pipeline to automatically pack our source code into a managed solution artifact and a release pipeline to deploy that artifact to downstream environments.
Today, we'll add a critical layer of quality assurance directly into our automated workflow. The learning outcome for this lesson is to incorporate automated solution checking using the Power Apps Checker into a build pipeline. This practice, often called "shifting left," helps you find and fix issues earlier, making your deployments more reliable and your solutions more robust.
The Role of Static Analysis in Power Platform ALM
From your experience in C# and .NET development, you're familiar with static code analysis tools like Roslyn Analyzers or SonarQube, which check code for potential bugs, style violations, and security vulnerabilities without executing it.
The Power Apps Checker serves the same purpose for Power Platform solutions. It performs a rich static analysis check on your solution against a set of best-practice rules defined by Microsoft. This helps you identify problematic patterns related to:
- Performance: Detecting inefficient FetchXML queries, client-side scripting issues, or plugin designs that could slow down the user experience.
- Stability & Reliability: Finding unsupported customizations, uses of deprecated APIs, or error handling omissions.
- Security: Highlighting potential vulnerabilities in your configuration or code.
- Accessibility: Ensuring your apps can be used by people with disabilities.
By integrating this checker into our build pipeline, we create an automated quality gate. The build will fail if the solution doesn't meet the defined quality standards, preventing poor-quality code from ever becoming a release artifact.
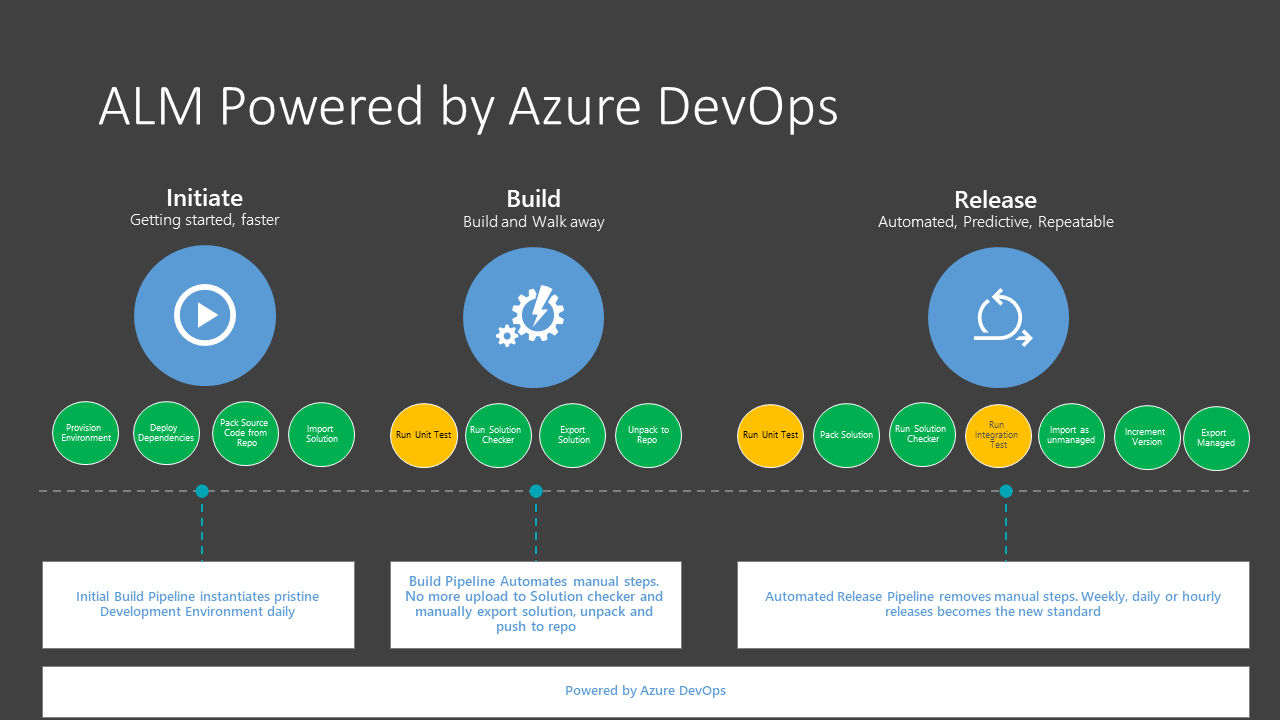
Integrating the Power Apps Checker into a Build Pipeline
Let's modify the build pipeline we created a few lessons ago. The goal is to add the checker task after the solution has been exported but before the managed artifact is created and published.
Step 1: Add the Power Platform Checker Task
The Power Platform Build Tools for Azure DevOps, which you've already installed, includes a dedicated task for this.
To start, let's watch a brief demonstration of how this task is added and configured in a pipeline.
How to Deploy Power Platform with Azure DevOps
This clip from the 'How to Deploy Power Platform with Azure DevOps' video by DevOps on Azure shows the practical application of the Power Platform Checker task. Pay close attention to where it's placed in the pipeline and its basic configuration.
Watch from 11:02 to 12:02. The presenter explains the purpose of the checker, shows how to authenticate, and discusses how the results can influence the pipeline's execution.
As the video demonstrates, you'll add the Power Platform Checker task to your build pipeline's agent job. The logical sequence of tasks should be:
- Power Platform Tool Installer (already present)
- Power Platform Export Solution (already present)
- Power Platform Unpack Solution (already present)
- Power Platform Pack Solution (already present)
- Power Platform Checker (the new task)
- Copy Files and Publish Artifacts (already present, may need adjustment)
The checker needs to analyze the .zip file of your solution. It's often most efficient to run it on the unmanaged solution file you just packed.
Step 2: Configure the Task Parameters
For a detailed understanding of all available options, the official Microsoft documentation is the best source.
Microsoft Power Platform Build Tools tasks
This Microsoft Learn article, 'Microsoft Power Platform Build Tools tasks', provides the definitive reference for the checker task. We will focus on the specific section for the Power Platform Checker.
In the article, find the 'Quality check' section and read the subsection for 'Power Platform Checker'. Pay close attention to the 'Parameters (Checker)' table. You don't need to memorize every parameter, but understand the purpose of the required ones and those that control failure behavior.
Based on the documentation, here are the critical parameters to configure:
PowerPlatformSPN: The service connection to a Power Platform environment. The checker is a service that requires an authenticated context to run, even though it analyzes a local file. This can be the same service connection used for exporting the solution.FilesToAnalyze: The path to the solution zip file(s) you want to check. You can use wildcards. For example, to check the unmanaged solution you just packed:$(Build.ArtifactStagingDirectory)/*_unmanaged.zip.RuleSet: This determines which rules to check against. You'll typically useSolution checker, which is the standard set of rules run from the Power Apps maker portal. TheMarketplaceruleset is more stringent and is used for solutions being certified for AppSource.
Step 3: Configure the Quality Gate (Controlling Failure)
Simply running the checker is not enough; we need to use its results to enforce quality. This is where the task becomes a true quality gate.
Solution Checker in Devops Pipeline
This article, 'Solution Checker in Devops Pipeline', offers a practical walkthrough and highlights how to configure the checker to act as a gate.
Read the article, focusing on the discussion of 'Error level' and 'Error threshold'. This explains how you can fine-tune the conditions under which the pipeline should fail.
As the article explains, you can control the pipeline's outcome using these key parameters:
ErrorLevel: Specifies the minimum severity level (e.g.,High,Medium) that should be considered when evaluating the threshold.ErrorThreshold: The number of issues at or above theErrorLevelthat are allowed before the task fails. A value of0means the pipeline will fail if even one issue of the specified severity is found.FailOnPowerAppsCheckerAnalysisError: If set to true, this will fail the task if the checker service itself encounters an error during analysis. This is a recommended setting.
For example, a common strict configuration would be:
ErrorLevel:HighErrorThreshold:0
This configuration fails the build if any issue classified as 'High' or 'Critical' is detected, forcing the developer to fix it before their code can be merged or deployed.
Test your understanding!
You want to configure your build pipeline to be very strict about performance issues but more lenient on lower-impact warnings. The checker identifies a specific performance rule il-avoid-specialized-update-ops as Medium severity, but your team considers it critical. How could you configure the PowerPlatformChecker task to fail the build if this specific rule is violated, without failing for all other Medium severity issues?
Show answer
You would use the RulesToOverride parameter. You could provide a JSON array to change the severity of that specific rule for this pipeline run.
Example YAML input:
RulesToOverride: '[{"Id":"il-avoid-specialized-update-ops","OverrideLevel":"High"}]'
ErrorLevel: 'High'
ErrorThreshold: 0
This configuration effectively "promotes" the il-avoid-specialized-update-ops rule to High severity. The ErrorThreshold of 0 for High level issues would then cause the build to fail if this specific performance issue is detected.
Reviewing Checker Results
When a build fails due to a checker violation, developers need a clear, actionable report to understand and fix the issues. The checker task outputs its results in a standard file format called SARIF (Static Analysis Results Interchange Format).
Azure DevOps has excellent support for viewing these files directly within the build summary. To enable this, you need to install a free extension from the Marketplace:
- SARIF SAST Scans Tab
Once this extension is installed in your Azure DevOps organization, a new "Scans" tab will appear in your build pipeline's run summary. This tab provides a rich, filterable view of all the issues found by the checker, including:
- The rule that was violated.
- The severity of the issue.
- The specific solution component and even the line of code affected.
- A link to Microsoft documentation explaining the issue and how to resolve it.
This tight feedback loop is crucial for enabling developers to quickly address quality issues.
Conclusion
You have now enhanced your CI pipeline with an automated quality gate. By incorporating the Power Apps Checker, you ensure that every solution is validated against Microsoft's best practices before it's even considered for deployment.
Key Takeaways:
- The Power Apps Checker is a static analysis tool that finds performance, stability, and security issues in your solutions.
- It should be added to your build (CI) pipeline after exporting the solution to act as an early quality gate.
- The
PowerPlatformCheckertask requires authentication and the path to the solution.zipfile. - You can control when the pipeline fails using the
ErrorLevelandErrorThresholdparameters. - Checker results are output as a SARIF file, which can be easily viewed in Azure DevOps using the SARIF SAST Scans Tab extension.
Preview of the Next Lesson
We have now built a robust, automated CI/CD pipeline for a single stream of development. However, enterprise projects involve teams of developers working in parallel. In our final lesson of this module, we will address this by learning how to develop an environment and branching strategy for team-based Power Platform development.