Hello and welcome back to your advanced Power Platform development course.
In our last lesson, we explored how to create richer user experiences by embedding Canvas Apps directly into Model-driven App forms. As your applications become more complex and integrated, ensuring they perform well and are easy to debug becomes paramount. This is where our focus for today lies.
The learning outcome for this lesson is to debug and analyze Canvas App performance using the Monitor tool. You'll learn how to go "under the hood" to see the real-time activity your app is generating, from network requests to formula evaluations. This skill is fundamental for any professional developer aiming to build efficient, scalable, and robust Power Apps.
We'll cover how to launch and interpret Monitor sessions, and then dive into practical scenarios where it can help you diagnose and solve common performance bottlenecks and errors.
1. What is the Monitor Tool?
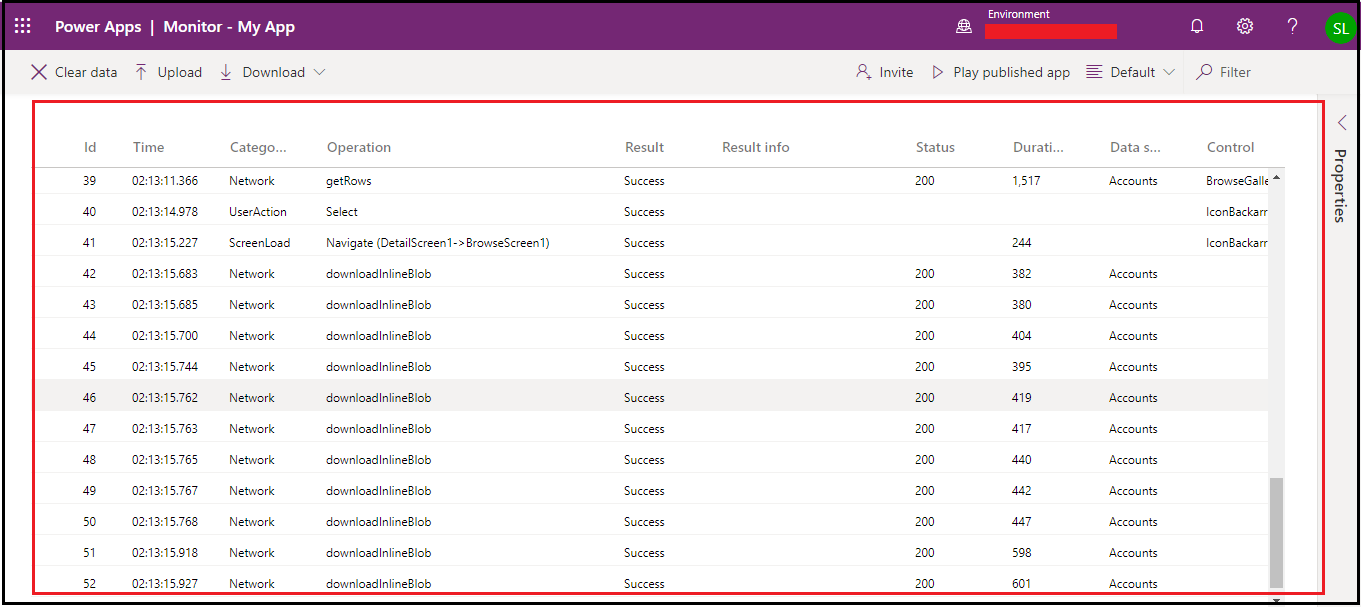
Think of Monitor as a live diagnostic trace for your Canvas App. It runs in a separate browser tab and provides a running log of all the events occurring within your app, with a special focus on network activity. Since you have a background in web development, you can think of it as being similar to the Network tab in a browser's developer tools, but with direct links back to the Power Fx formulas that triggered the requests.
Monitor allows you to see:
- How your declarative formulas are translated into actual operations.
- The sequence and duration of network calls to your data sources.
- Data payloads for requests and responses.
- Errors that might not be immediately visible to the end-user, such as API rate limit exceptions.
2. Accessing and Understanding the Monitor
You can use Monitor for apps during the development process in Power Apps Studio and also to debug already published apps being used by your end-users.
To get started, please review the official Microsoft documentation, which covers the essential steps for launching a Monitor session.
Debugging canvas apps with Live monitor
This Microsoft Learn article will guide you on how to start a Monitor session for both apps in development and published apps. It also introduces the key components of the Monitor UI.
Please read the following sections: 'Get started with Live monitor in canvas apps': This covers opening Monitor while authoring an app. 'Open Live monitor for a published app': This explains how to connect to a live, published app session. 'Setting: Debug published app': Pay close attention to this setting. It's crucial for mapping Monitor events back to your source code in a published app, but be mindful of the performance impact it has.
Key Components of a Monitor Event
When you analyze an event in Monitor, you'll see several tabs:
- Details: An overview of the event, including its duration and status.
- Formula: Shows the Power Fx formula from the control property that initiated the event. This is the critical link between app behavior and your code.
- Request: The raw HTTP request sent to the data source.
- Response: The raw HTTP response received from the data source. You can view this as a table or raw JSON.
The most important columns in the main event grid for performance analysis are Duration, which tells you how long an operation took, and Result / HTTP status, which tells you if it succeeded.
3. Practical Use Case: Diagnosing a "Chatty" Application
A common performance issue is an app that makes too many network requests, often called a "chatty" app. This can lead to slow load times and even errors due to API throttling (i.e., exceeding the number of allowed requests in a given time).
Monitor is the perfect tool for diagnosing this. Let's look at a classic example.
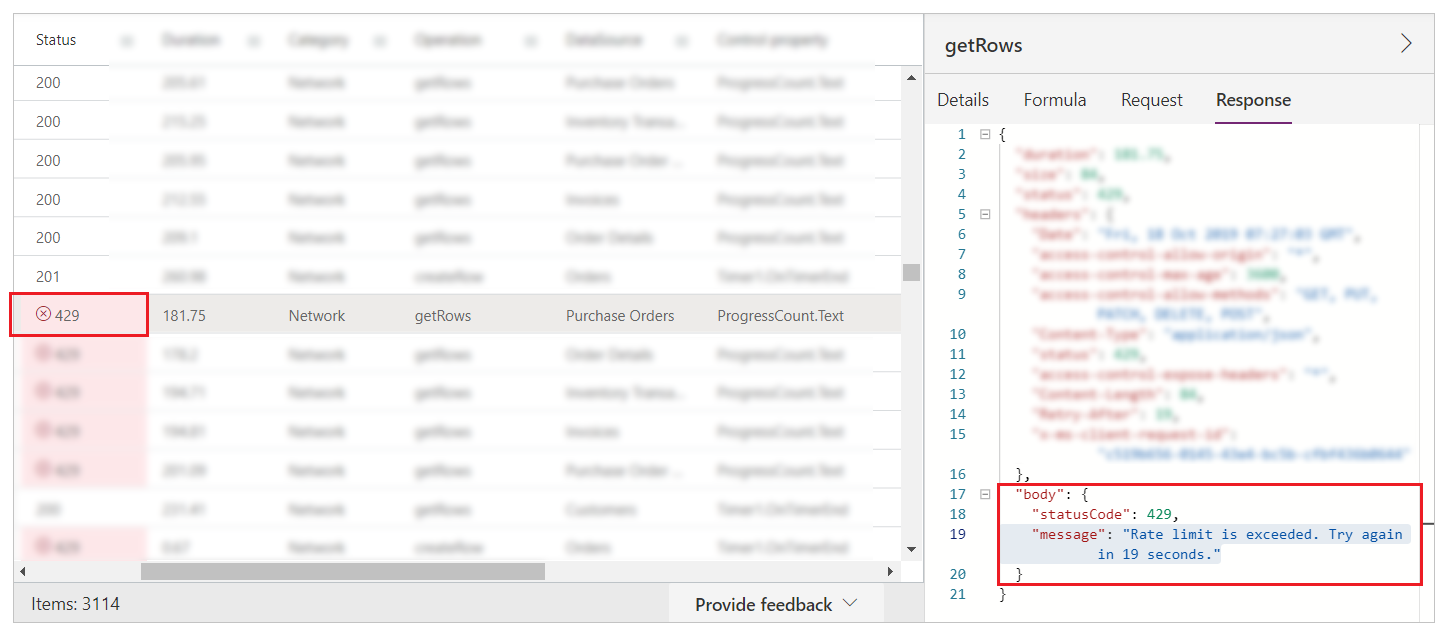
This error often occurs when a formula inside a gallery re-evaluates for every row, triggering a new network request each time. For example, using CountRows() on a remote data source within a label that updates frequently can trigger a massive number of getRows requests, quickly hitting the service protection limits of Dataverse or other services.
The solution, which you would be led to by analyzing the Monitor log, is to refactor your logic. Instead of re-calculating on the fly, you might cache the count in a variable and only update it when the underlying data actually changes.
Introducing Monitor to debug apps and improve performance
This blog post, which introduced the Monitor tool, contains a perfect real-world example of diagnosing and fixing the exact throttling issue described above. It provides excellent context on why a declarative language like Power Fx sometimes needs a tool like Monitor to understand its imperative execution.
Please read the sections 'Finding issues' and 'Declarative insights'. Focus on how the developer uses the Monitor log to trace the HTTP 429 errors back to a specific CountRows formula and how they resolved it.
4. Deep Dive: Optimizing Data Operations with Monitor
Now let's move from diagnosing errors to proactively optimizing performance. The way you write your Power Fx formulas can have a significant impact on the number and type of network calls your app makes. Monitor is the only way to get empirical proof of which patterns are most efficient.
The following video is a masterclass in using Monitor to analyze the performance of various Patch function syntaxes—a common operation in any data-driven app. Given your preference for practical, code-focused examples, you will find this highly valuable.
PowerApps Performance Optimization - Use Monitor to understand Patch of data sources
Shane Young provides an in-depth analysis of different ways to write single and bulk Patch operations, using Monitor to prove which methods are the most performant. This is a must-watch for any serious Power Apps developer.
This video is dense with excellent information. Please watch these key segments: Opening Monitor & Single Record Patches (04:44 - 11:10): See how Monitor is used to prove that using With vs. a LookUp inside Patch results in the same network activity. The Most Efficient Single Patch (11:10 - 16:06): Pay close attention to the syntax that provides the record's primary key directly (Patch(Source, {ID: ...})). Note in Monitor how this reduces three network calls to just one. Bulk Updates (ForAll vs Collect) (16:06 - 20:16): Observe in Monitor how both ForAll and Collect result in sequential, one-by-one network calls for SharePoint and SQL. The Parallel Bulk Update (20:16 - 25:34): This reveals a powerful, undocumented syntax (Patch(Source, collection)) that performs parallel updates, drastically improving performance. This is a pro-level technique. A Monitor 'Gotcha' (25:34 - 30:19): This is a crucial troubleshooting tip. Understand why Monitor might not show a Patch operation if Power Apps determines the value isn't changing, and how this can be confusing if you're not aware of this optimization.
Key Takeaways from the Video:
- For updating a single record where you know the ID,
Patch(MyDataSource, {ID: recordID}, {ColumnToUpdate: "New Value"})is far more performant than doing aLookUpfirst. - For bulk updates in SharePoint/SQL,
Patch(MyDataSource, MyCollection)is significantly faster than looping withForAllbecause it issues network requests in parallel. - Power Apps is smart. It won't issue an update call if the data hasn't changed. Monitor reflects this, which is something to remember when testing.
Test your understanding!
You are building a Canvas App to update product inventory. In a gallery, the user can change the 'Quantity on Hand' for multiple products. On a 'Save' button, you need to patch all the changes back to a SQL Server database.
Based on what you learned, which Power Fx approach would you use on the OnSelect of the save button to achieve the best performance, and why?
Show answer
The most performant approach would be to first collect all the changes from the gallery into a collection, and then use the Patch(SQLTable, ChangesCollection) syntax.
Example code:
// OnSelect of the Save button
ClearCollect(
    colChanges,
    ForAll(
        Filter(MyGallery.AllItems, IsDirty), // Assuming a flag for changed items
        {
            ID: ThisRecord.ID, // The primary key of the SQL record
            QuantityOnHand: ThisRecord.QuantityInput.Text // The new value from an input
        }
    )
);

Patch(ProductsSQL, colChanges);
Reasoning: As demonstrated in the video analysis with Monitor, using Patch with a collection on a SQL data source issues the update requests in parallel, rather than sequentially one-by-one as a ForAll(Patch(...)) loop would. This results in a much faster bulk update operation.
Conclusion
In this lesson, you've added a critical diagnostic tool to your Power Platform developer toolkit. By mastering the Monitor, you can move beyond guessing and start making data-driven decisions to improve your app's performance and reliability.
Key Takeaways:
- Monitor is your window into the app's runtime behavior, translating declarative formulas into observable network calls and operations.
- It is essential for diagnosing performance issues like "chatty" apps and throttling errors (HTTP 429).
- Use Monitor to empirically test and verify the most performant Power Fx patterns, especially for data operations like
Patch. - Always analyze the Duration and number of network calls for any significant user action to identify optimization opportunities.
Up Next:
Monitor is fantastic for active, real-time debugging. But what about tracking performance and errors for your users in a live production environment when you're not actively watching? To solve that, we need more powerful, production-grade telemetry. In our next lesson, you will learn how to integrate a Canvas App with Application Insights for custom telemetry and analytics.