Hello and welcome back to our course on advanced Power Platform development.
In our last lesson, we mastered the Monitor tool, your go-to for real-time, interactive debugging of Canvas Apps. We saw how it helps trace network calls and diagnose performance issues while you are actively building or testing. However, professional development requires more; we need to understand how our apps behave in the wild, in the hands of actual users, even when we aren't watching.
This brings us to today's topic. Our learning outcome is to integrate a Canvas App with Application Insights for custom telemetry and analytics. Think of Application Insights as your production-grade monitoring and analytics service. Where Monitor is a microscope for live debugging, Application Insights is a telescope for observing long-term trends, user behavior, and application health in a production environment. Given your background in .NET development, you can equate this to implementing a robust logging and telemetry framework like Serilog or NLog, but specifically tailored for the Power Platform.
We will cover setting up Application Insights, understanding the data it collects automatically, and, most importantly, how to use the Trace() function to send rich, custom telemetry to answer specific questions about your app's usage and performance.
1. From Debugging to Production Analytics
While Monitor is excellent for a developer's interactive session, it's not designed for continuous, unattended monitoring of all user sessions. Application Insights, a feature of Azure Monitor, fills this gap by providing a scalable service to:
- Collect telemetry data from your published apps.
- Analyze user behavior, performance metrics, and errors using a powerful query language.
- Visualize this data in dashboards and reports.
- Alert you proactively when things go wrong.
2. Setting Up the Integration
The first step is to create an Application Insights resource in Azure and then link your Canvas App to it. The process is straightforward and relies on a connection string.
The official Microsoft documentation provides a clear, step-by-step guide. Please read through the initial sections to understand the setup process.
Analyze system-generated logs using Application Insights
This article, 'Analyze system-generated logs using Application Insights,' from Microsoft Learn will be our primary guide. It covers creating the Azure resource and connecting it to your app.
Please read the following sections: 'Prerequisites': Note the requirement for Azure permissions and the tenant-level setting that an admin must enable. 'Create an Application Insights resource': This section links to the standard Azure procedure for creating a workspace-based resource. You can skim this if you are already familiar with creating resources in Azure. 'Connect your app to Application Insights': This is the key part. Pay close attention to the steps for adding the Connection String to your app's properties in Power Apps Studio.
Once you retrieve the connection string from your Application Insights resource in the Azure portal, you simply paste it into the corresponding property on the App object in your Canvas App.

After saving and publishing your app, it will automatically start sending telemetry data.
Important Note: Some older articles or community posts might refer to an "Instrumentation Key." This is a legacy method. The Connection String is the current and recommended approach.
3. Understanding Automatic Telemetry
Once connected, your app immediately starts sending valuable telemetry without any additional code. This includes:
- Page Views: Every time a user navigates to a screen.
- User Sessions: Grouping user activity into sessions.
- Client-side details: Browser type, operating system, user's country/region.
- App Lifecycle Events: Information about app load times and success rates.
You can explore this data directly in the Azure portal. The Users, Events, and Performance blades in Application Insights provide rich, out-of-the-box visualizations.
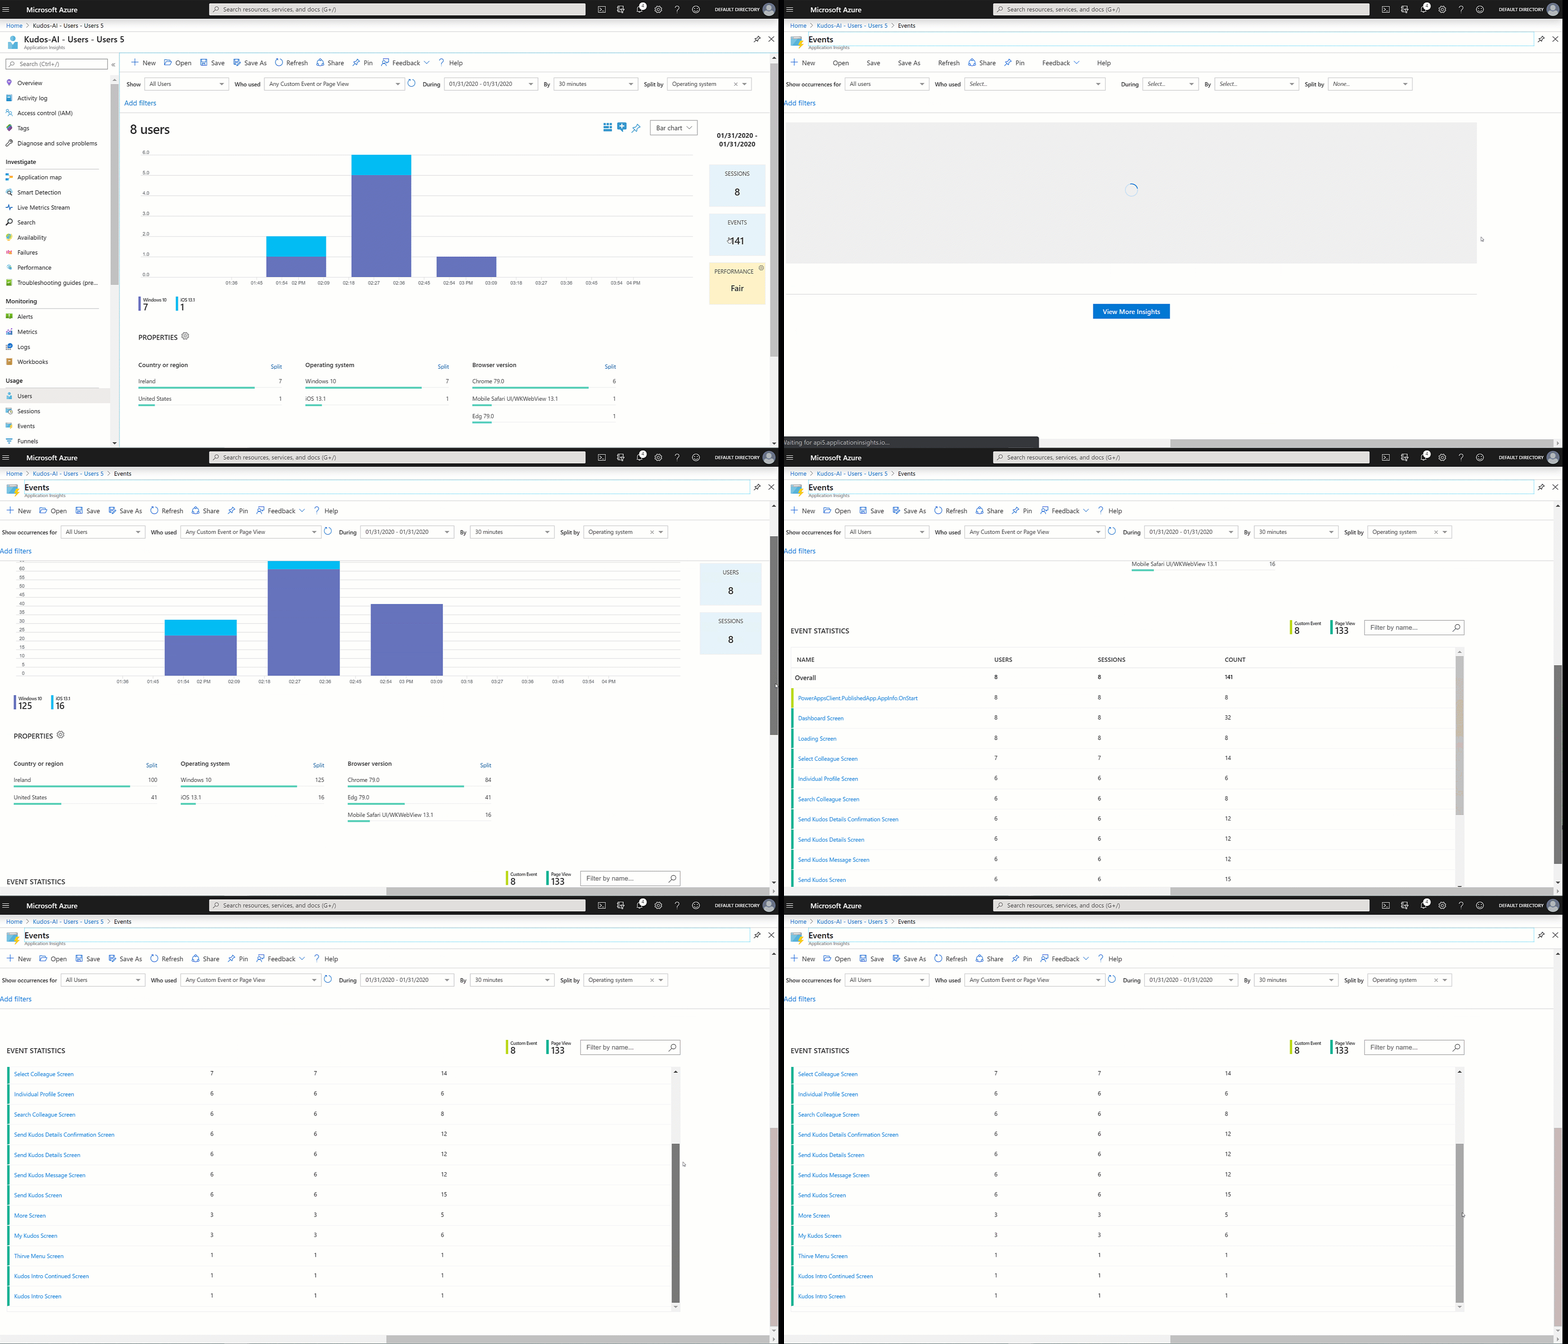
The community blog post "Monitoring the Power Platform: Canvas Apps" provides a good summary of the different tables where this automatic data lands in Application Insights.
Monitoring the Power Platform: Canvas Apps
This blog post offers a great overview of the different data tables that are automatically populated when you connect a Canvas App to Application Insights.
Please read the section 'Exploring what's delivered'. It gives a concise breakdown of the customEvents, pageViews, and browserTimings tables.
4. Implementing Custom Telemetry with Trace()
While automatic telemetry is useful, the real power for a developer comes from logging custom events. This is where you move from generic monitoring to answering specific questions about your application, such as:
- Which features are used most often?
- How long does a specific, multi-step business process take for the user?
- What were the specific input values when a non-critical warning occurred?
In Power Apps, you achieve this using the Trace() function. Its syntax is:
Trace( message, [severity], [custom_record] )
message: A string that describes the event (e.g., "SaveButton Clicked").severity(Optional): An enumeration (TraceSeverity.Information,TraceSeverity.Warning,TraceSeverity.Error). This is analogous to log levels in other frameworks.custom_record(Optional): A record containing custom key-value pairs. This is where you add the rich contextual data that makes your telemetry so valuable.
Let's walk through the excellent example from the Microsoft Learn documentation on how to implement this.
Analyze system-generated logs using Application Insights
We will now return to the main Microsoft Learn article to see a practical implementation of the Trace() function.
Please read the section 'Create custom trace events'. Follow the example of creating a feedback component. Pay special attention to the Trace() formula itself. Notice how it captures not just the feedback value, but also user details and the current screen, all within the custom_record.
Here is the core of the example formula:
Trace(
    "App Feedback",  // Message
    TraceSeverity.Information,  // Severity
    {   // Custom Data Record
        UserName: User().FullName,
        UserEmail: User().Email,
        Screen: App.ActiveScreen.Name,
        FeedbackValue: "1"
    }
);
This single line of code sends a structured log to Application Insights that tells you who gave feedback, what screen they were on, and what their feedback was. This is far more powerful than a simple text log.
5. Analyzing Custom Data with KQL
Collecting data is only half the story. You need to be able to query and analyze it. In Application Insights, this is done using the Kusto Query Language (KQL). KQL is a powerful, read-only query language designed for analyzing large datasets, and it's a critical skill for working with Azure monitoring services.
All events sent via the Trace() function land in the traces table in Application Insights Logs. The custom data you provided is stored as a JSON object in the customDimensions column.
To analyze this data, you'll need to parse this JSON. The Microsoft Learn article shows exactly how to do this.
Analyze system-generated logs using Application Insights
Let's conclude our review of the Microsoft Learn article by learning how to query the custom data we just logged.
Please read these two sections: 'Analyze custom data in Application Insights': This is the most important part. Focus on the KQL query that uses parse_json() and project to transform the raw customDimensions data into clean, usable columns. 'Monitor unhandled errors (experimental)': Skim this section to see how you can also automatically capture unhandled Power Fx errors, which are logged to the same traces table.
The key KQL query pattern looks like this:
traces
| where message == "App Feedback"
| extend customdims = parse_json(customDimensions)
| project
    timestamp,
    message,
    FeedbackFrom = customdims.UserEmail,
    Screen = customdims.Screen,
    FeedbackValue = customdims.FeedbackValue
| order by timestamp desc
This query finds all "App Feedback" traces, expands the custom dimensions, and projects them as top-level columns, making the data easy to read and aggregate.
Test your understanding!
You've added a Trace() function to your app that fires when a user saves a complex form. The trace looks like this:
Trace(
    "FormSaved",
    TraceSeverity.Information,
    {
        FormName: "ProjectDetailsForm",
        TimeSpentOnForm: (Now() - varFormOpenedTime) / 1000, // Time in seconds
        ItemsInSubgrid: CountRows(SubgridGallery.AllItems)
    }
)
Write a KQL query to find all "FormSaved" events where the user spent more than 60 seconds on the form, and display the timestamp, the form name, and the number of items in the subgrid.
Show answer
traces
| where message == "FormSaved"
| extend customdims = parse_json(customDimensions)
| extend TimeSpent = toreal(customdims.TimeSpentOnForm) // Convert to a numeric type for comparison
| where TimeSpent > 60
| project
    timestamp,
    FormName = customdims.FormName,
    ItemsInSubgrid = customdims.ItemsInSubgrid
| order by timestamp desc
This query correctly filters by the message, parses the custom dimensions, casts the TimeSpentOnForm property to a real number (toreal) to enable a numeric comparison, filters for records greater than 60, and finally projects the requested columns.
Conclusion
You have now learned how to equip your Canvas Apps with professional-grade telemetry using Application Insights. This capability elevates your applications from simple tools to managed assets, allowing you to proactively monitor their health, understand user engagement, and make informed decisions for future enhancements.
Key Takeaways:
- Application Insights is for production monitoring, capturing telemetry from all user sessions.
- The integration is simple: create a resource in Azure and add the Connection String to your app's properties.
- The
Trace(message, severity, custom_record)function is your tool for sending custom, structured telemetry. This is essential for detailed analytics. - KQL is the language used to query and analyze the collected data in the Application Insights Logs workspace, allowing you to parse custom dimensions and gain deep insights.
Up Next:
Now that you've mastered monitoring and debugging, our next step is to enhance your app's data integration capabilities. In the following lesson, you will learn how to consume data from a pre-built custom connector within a Canvas App. This will open the door to connecting your apps to virtually any REST API, a cornerstone of advanced Power Platform development.