Hello! Welcome to your eighth and final lesson in the "Foundations for System Design" module.
In our last session, we explored the spectrum of data processing models—from delayed batch systems to real-time streaming systems—and discussed how the architectural choice of data freshness directly impacts user experience and business outcomes. We saw that a system can feel fast (low latency) but be dangerously misleading if the data is stale.
Today, we build on that idea. Once we have our data, we must decide what to measure. This choice is not neutral; it shapes the behavior of our teams and the evolution of our product. We will explore a critical principle that every system architect and product designer must understand to avoid building systems that accidentally sabotage their own goals.
Our learning outcome for this lesson is to explain Goodhart's Law and how focusing on a single metric can distort system goals. This concept is a bridge from foundational technical and economic principles to the broader world of systems thinking, which we will begin in the next module.
1. Introduction to Goodhart's Law: The Cobra Effect
Metrics are essential. They help us simplify a complex world, track progress, and make data-driven decisions. However, when we become too focused on a single number, something strange and often counter-productive happens. This phenomenon is captured by Goodhart's Law.
To start, let's watch a short video that explains the core idea through a famous (though possibly apocryphal) story.
The Unintended Consequences of Measuring Things
The video 'The Unintended Consequences of Measuring Things' from iluli by Mike Lamb provides an excellent introduction to why metrics can be dangerous and introduces Goodhart's Law with the classic 'cobra effect' example.
Please watch from the beginning until 03:00. This segment covers how metrics are simplifications and then formally introduces Goodhart's Law.
The video introduces two key ideas:
- Metrics are a simplification of reality, not reality itself.
- When we forget this and make the simplified metric a target for rewards or punishments, people will optimize for the metric itself, not the original, more complex goal.
This brings us to the most common phrasing of Goodhart's Law:
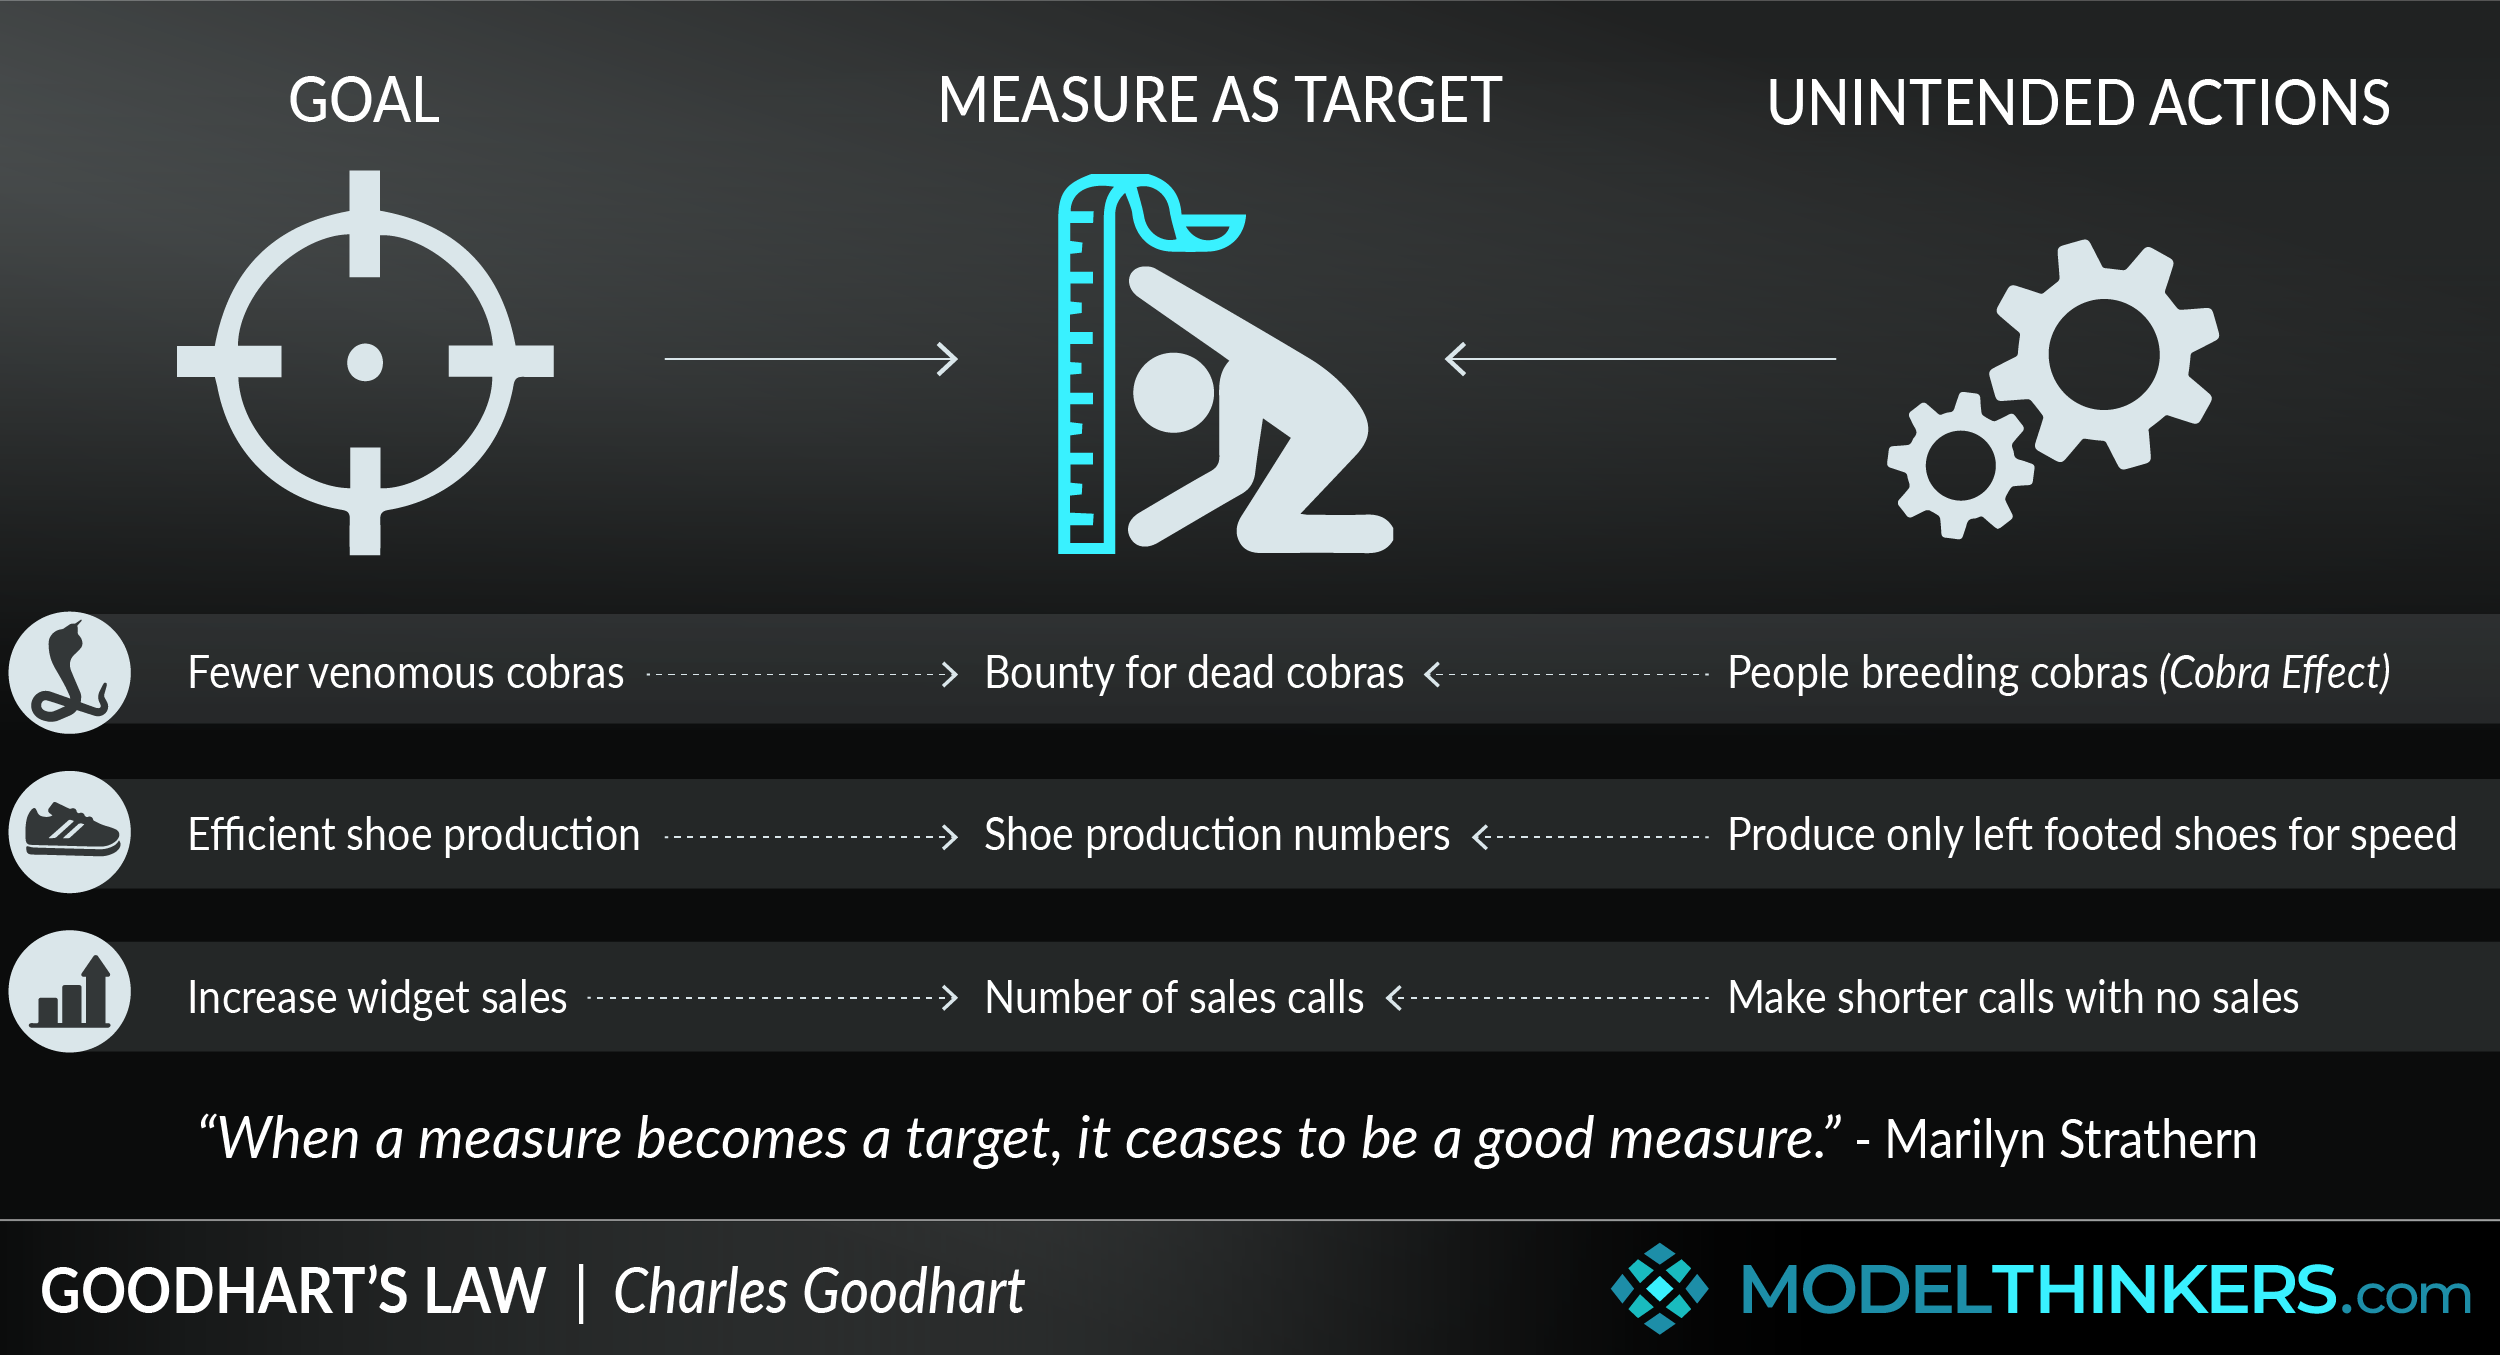
"When a measure becomes a target, it ceases to be a good measure."
The "cobra effect" is the classic illustration.
2. The Root Cause: Metrics as Proxies
Why does this happen? The core reason is that the metrics we choose are almost always proxies for a deeper, more complex goal that is hard to measure directly.
- Real Goal: We want our customers to be happy and successful.
- Proxy Metric: We measure
Daily Active Users (DAU).
The problem arises when the organization's focus and incentives shift from the real goal to the proxy. The team is now judged on their ability to increase DAU, not necessarily to make customers happy.
What is Goodhart's Law? And Why does it Matter?
The video 'What is Goodhart's Law?' provides a great discussion on this concept of metrics as proxies and how communication of the real goal is critical.
Watch the segment from 03:04 to 07:57. The speakers discuss how measurements are just proxies and give a great example from the API world where a mandate to 'publish more APIs' resulted in many low-quality, unusable APIs because the real goal (creating value through APIs) was lost.
As the video highlights, people will find the most efficient way to hit the target, even if it subverts the original intent. The team tasked with increasing API count did exactly what they were asked, but the outcome was a system cluttered with useless components, ultimately harming the developer experience—the very thing they likely wanted to improve.
3. Goodhart's Law in Digital Product Design
As a UI/UX designer, you are on the front lines of this battle. Many design decisions are influenced by Key Performance Indicators (KPIs). When those KPIs are poorly chosen or too narrowly focused, they can directly incentivize the creation of "dark patterns" and poor user experiences.
The Nielsen Norman Group, a leading voice in UX research, has an excellent article on this topic. It provides powerful examples of how metric fixation leads to product decisions that are hostile to users.
Campbell’s Law: The Dark Side of Metric Fixation
The article 'Campbell’s Law: The Dark Side of Metric Fixation' is highly relevant to your work. It shows how metric obsession manifests directly in the design of digital products.
Please read the sections titled 'Campbell’s Law in Everyday Life' and 'Campbell’s Law in Design'. Pay close attention to the streaming service and Facebook case studies.
Let's break down the examples from the article, as they are directly applicable to your work:
- Healthcare Hold Times: The goal was "improve patient experience by reducing wait times." The proxy became "reduce the 'on hold' timer." The result? Staff muted calls instead of using the hold function, often increasing the total wait time for the patient and creating a worse experience, even though the metric looked great.
- Gig-Economy Ratings: The goal is to measure service quality. The proxy is a 5-star rating. Because a low rating can cause a driver or host to be de-platformed, they are incentivized to pressure you for a 5-star rating, corrupting the data.
- Streaming Service Cancellation: This is a perfect UX example.
- Goal: Retain customers.
- Proxy: Reduce the number of users who complete the cancellation flow.
- Result: The design team was incentivized to create a confusing and difficult cancellation flow. Users would give up online (making the metric look good) but were still angry and would cancel by calling support. The metric improved while the actual business outcome (retention, user satisfaction, support costs) worsened.
- Facebook's Engagement Focus:
- Goal: Grow a healthy, connected community.
- Proxy: Maximize engagement (Daily Active Users, time on site, clicks, comments).
- Result: The algorithms optimized for whatever produced the most engagement, which often turned out to be polarizing, outrageous, or false content. The proxy was achieved, but the health of the system was damaged.
4. How to Avoid the Trap: A Systems Approach to Metrics
Recognizing Goodhart's Law is the first step. Actively designing systems to resist it is the next. This requires moving away from a simplistic "one metric to rule them all" mindset.
The same Nielsen Norman Group article provides excellent strategies for this.
Campbell’s Law: The Dark Side of Metric Fixation
Let's continue with the same article to learn about mitigation strategies.
Now, read the section 'How to Avoid Dangerous Metric Obsession'. It offers four clear, actionable principles.
Here is a summary of those strategies, which are fundamental to robust system design:
-
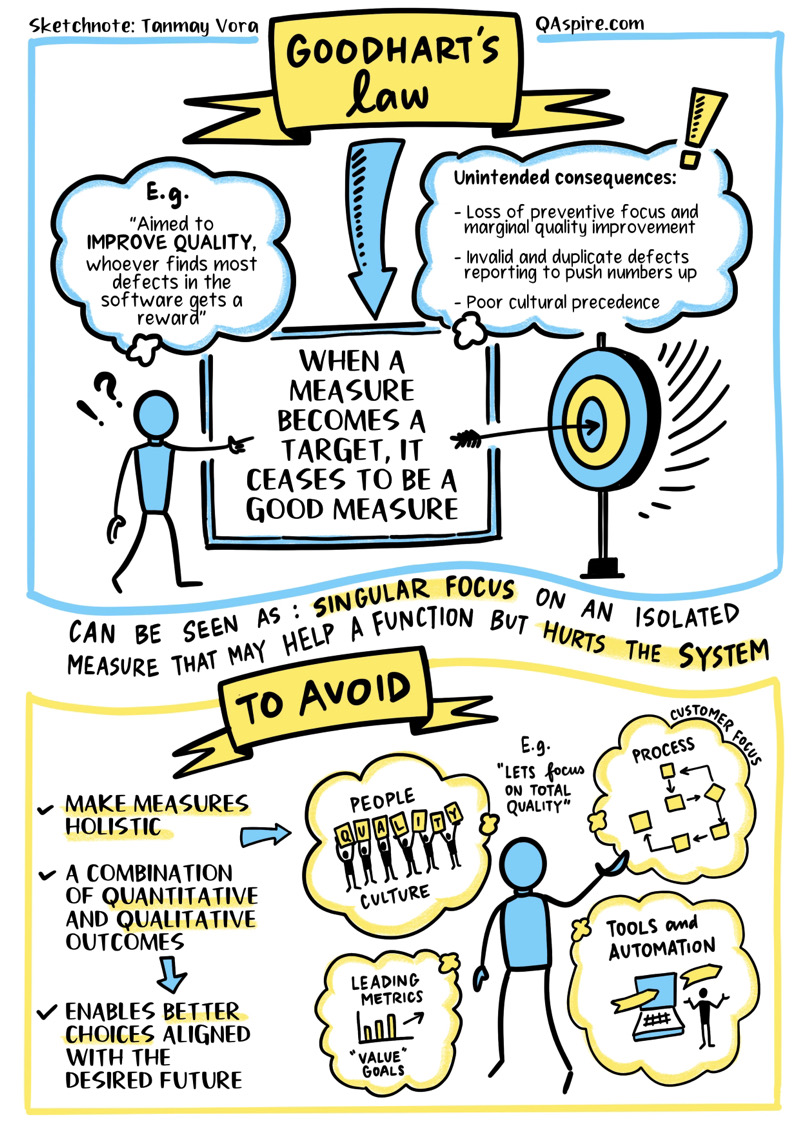
Use a Constellation of Metrics: Never rely on a single metric. Instead, use a "balanced scorecard" with metrics that are in tension with each other.
- If you measure
User Engagement, you must also measureUser-Reported SatisfactionandBlock/Mute Rates. - If you measure
Conversion Rate, you must also measureReturn RateandCustomer Support Ticket Volume.
This makes it much harder to game the system, because improving one metric at the expense of another will be immediately obvious.
- If you measure
-
Triangulate with Qualitative Data: This is a core function of UX. Quantitative analytics tell you what users are doing (e.g., "70% of users drop off on this screen"). Qualitative research (like usability tests and user interviews) tells you why ("...because the button is confusing and they think the process is broken"). Without the "why," you are flying blind and risk optimizing for the wrong thing.
-
Focus on the Real Goal: Keep the true, high-level goal front and center in all communications. Don't just tell a team to "increase sign-ups." Tell them to "make it easier for qualified users to start using our product and see its value." The metric is a tool to assess progress toward that goal, not the goal itself.
-
Treat Data as a Tool, Not a Tyrant: Data should inform decisions, not make them. When a metric looks odd or points to an uncomfortable conclusion, it's a signal to dig deeper, not to blindly follow the number.
Conclusion
This lesson concludes our first module. We've laid a foundation by learning to interpret APIs, calculate costs, understand data timeliness, and now, to be wary of the very metrics we use to measure success.
Key Takeaways:
- Goodhart's Law states that when a measure becomes a target, it ceases to be a good measure.
- This happens because metrics are proxies for complex goals. Optimizing for the proxy can distort behavior and harm the actual goal.
- In product design, this can lead to dark patterns and poor user experiences that serve the metric but not the user or the business.
- Mitigation requires a systems approach: using a balanced set of quantitative metrics, enriching them with qualitative insights, and never losing sight of the true, underlying goal.
This brings us to the end of the "Foundations for System Design" module. You've covered the essential building blocks of technical and economic thinking needed for system architecture.
Next Lesson Preview:
In our next module, "Thinking in Systems: Modeling Products," we will dive deep into the world of systems thinking. Goodhart's Law is a classic systems thinking problem—a simple intervention (setting a target) creates unintended consequences that ripple through the system. We will learn to formally map these dynamics using tools like causal loop diagrams, allowing us to visualize and analyze the complex interplay of reinforcing loops, balancing loops, and delays that truly drive product behavior.